You notice the pressure behind your eyes before the rain arrives. The radar still looks clear, but your neck tightens, light feels harsher, and a migraine may be starting. A barometric pressure forecast can help you watch for that changing weather signal, but the useful information isn't one “low” or “high” number. It's the direction and speed of pressure change, especially across the hours when you're most vulnerable.
This article explains how to read that forecast without treating it as a diagnosis or a guarantee. You'll learn how pressure is measured, why rapid drops may matter more than stable low pressure, and how to compare the forecast with your own migraine records.
This article is for informational purposes and is not medical advice. Consult a healthcare provider for personalized guidance.
Table of Contents
When the Weather Turns and Your Head Knows First
The first sign may arrive while the sky still looks ordinary. You're answering emails or getting ready for work, then a familiar ache begins. Several hours later, clouds gather and rain starts. It can feel as if your head predicted the weather.
A barometric pressure forecast projects how atmospheric pressure is expected to change over the coming hours or days. That makes it different from a temperature forecast, which tells you how warm or cold the air may be, and from a precipitation forecast, which estimates the likelihood of rain or snow. Pressure forecasts focus on the weight of the air above you and how that weight is shifting.
Meteorologists have used barometric pressure and pressure tendency, meaning the change in pressure over time, as forecasting tools for generations. Scientific weather forecasting became practical in the 19th century, while the electric telegraph, invented in 1835, helped observations travel quickly across distance, supporting the modern forecasting era (weather forecasting history).
The migraine question is narrower. You are not just asking, “Is pressure low today?” You're asking, “Will pressure fall quickly during the hours when my attacks often begin?”
Practical rule: Treat the forecast as a timeline, not a snapshot.
A pressure curve that stays relatively stable may tell you something different from a sharp decline followed by recovery. Hour-by-hour risk layering adds context by placing that curve beside sleep, work, travel, symptoms, and other personal observations. It turns an abstract weather measurement into a planning signal, while still leaving room for the fact that migraine patterns vary widely.
What a Barometric Pressure Forecast Actually Measures
If your head starts warning you before the clouds arrive, the forecast can offer more than a general weather summary. It shows how atmospheric pressure may move during the hours ahead, giving you a timeline to compare with your own migraine pattern.
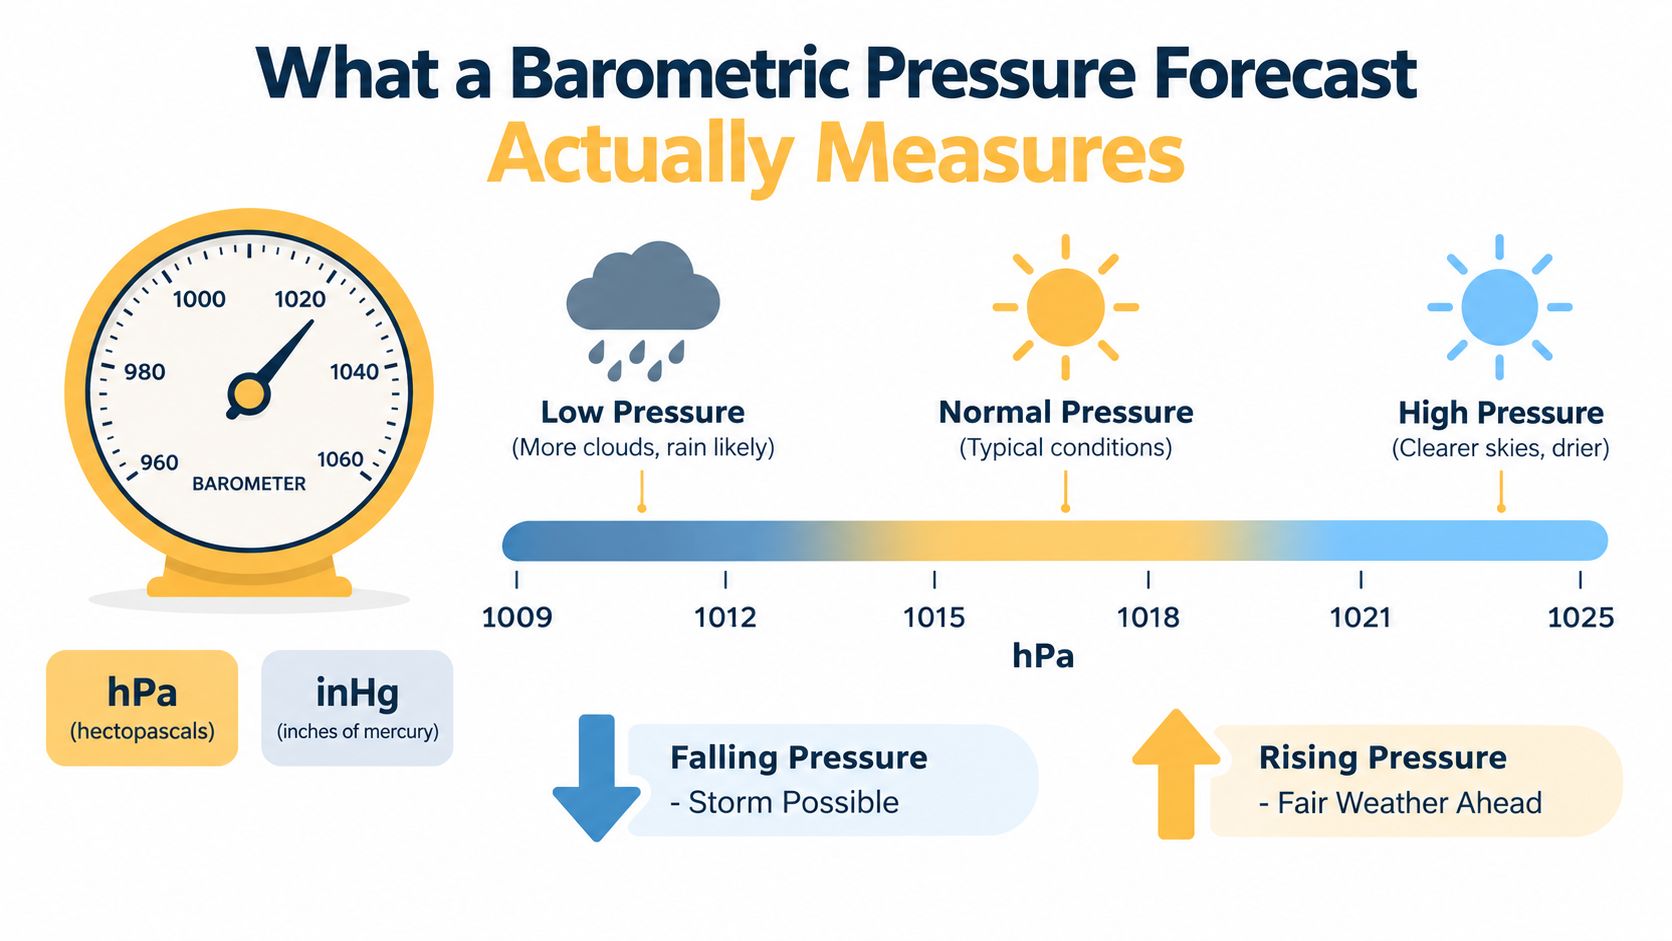
The basic unit is the hectopascal, or hPa. Some services use inches of mercury, or inHg. Standard sea-level pressure is about 1013 hPa, or 29.92 inHg, a reference for interpreting changes (meteorological pressure guidance). Local readings vary with elevation and weather systems, so one location's number cannot be judged in isolation.
Many forecasts show values around 1009 to 1025 hPa. Higher pressure often appears with more settled conditions, while lower pressure can occur alongside clouds, precipitation, or storms. The absolute number describes the current state. It does not show whether pressure is shifting slowly or dropping quickly.
A bathtub makes the difference easier to see. A regular weather forecast reports the water level. A barometric pressure forecast also shows whether the drain is open and how quickly that level is changing. For migraine planning, the slope may matter more than a single reading.
The vocabulary that matters
- High pressure: Pressure is higher than in nearby areas, often alongside clearer or more stable weather.
- Low pressure: Pressure is lower than in nearby areas, making clouds and unsettled conditions more likely.
- Rising pressure: Pressure is increasing, often as conditions improve.
- Falling pressure: Pressure is decreasing, often as a low-pressure system approaches.
- Pressure tendency: The direction and amount of change across a defined period, commonly three hours in operational forecasting.
Short-term meteorological guidance uses pressure tendency to help assess changing conditions over roughly three to six hours, especially around major low-pressure systems. That time window is useful when you are comparing a pressure curve with sleep, travel, work, or early symptoms.
For context on how pressure interacts with other weather variables, see this guide to temperature, humidity, and barometric pressure. The key distinction is simple: a pressure reading describes the moment, while pressure tendency describes movement.
Reading the Numbers Without Losing Your Mind
A forecast may display pressure readings for every hour, but you do not need to inspect each one. Treat the graph like a road profile: the direction and steepest section matter more than one point on the route. Start with three practical questions.
Which way is pressure moving? A falling line deserves closer attention when your diary shows that declines often precede attacks. Rising pressure can accompany improving weather, yet it does not automatically remove your risk. A steady line may be easier to interpret, especially when your symptoms usually appear during transitions.
How quickly is the change happening? Operational forecasting commonly evaluates pressure tendency over a three-hour interval. A change greater than 3.5 hPa is used as a practical sign of a more noticeable weather shift. Migraine research has examined larger movements as well. One PubMed-indexed study linked increased migraine frequency with pressure drops of more than 5 hPa around onset, while another report found attacks occurred most often during falls of 6 to 10 hPa (PubMed-indexed pressure study).
What does the next 24 hours look like? A short, sharp dip can matter more than a low reading that remains unchanged. Mark the hour when the decline is steepest, then compare it with sleep disruption, commuting, exercise, work demands, or the first signs you usually notice.
A quick reading guide
| Pressure Change, 3-hour window | What It Looks Like | Level of Attention |
|---|---|---|
| Rising | The line moves upward or the arrow points up | Lower attention if your records do not connect rises with symptoms |
| Nearly steady | The reading stays within about 1 to 2 hPa | Usually less concerning as a change signal |
| Falling | The line slopes downward or the arrow points down | Watch the timing and your personal history |
| Drop greater than 5 hPa | A pronounced decline over a few hours | Higher attention when it matches past attacks |
On a weather map, isobars connect places with equal pressure. Lines packed closely together usually indicate a stronger pressure gradient and potentially stronger winds. Arrows show whether pressure is rising or falling, while a forecast graph shows when that movement occurs. That timing is the useful difference between a pressure forecast and a general weather snapshot.
Do not treat any threshold as a diagnosis. Use it as a prompt to check your own pattern, protect sleep where possible, and plan demanding tasks outside your usual risk window.
Pair this method with an hour-by-hour migraine forecast when you want the pressure trend translated into more practical daily timing.
Why Pressure Drops Hit Some Migraine Brains So Hard
A changing barometer doesn't guarantee a migraine. Weather sensitivity isn't universal, and even people who react to pressure may not respond to every shift.
The clearest signal tends to involve rapid or substantial declines, not merely a low pressure value. A 2025 systematic review covering 14 studies and 2,696 participants found mixed overall results. Several studies linked pressure drops or rapid fluctuations with migraine frequency, but evidence was weaker for attack severity, and the review found no evidence that pressure predicts attack duration (2025 systematic review summary).
A diary-based study of 28 migraine patients found weather change was associated with migraine development in 18 patients, while 14 specifically identified low barometric pressure as a cause. The study also reported higher migraine frequency when pressure was more than 5 hPa lower from the headache day to the following day, while monthly mean pressure wasn't associated with headache frequency (diary-based migraine study).
Why responses differ
Researchers and clinicians discuss several possible explanations, including sensitivity in pain-processing pathways, pressure differences affecting the sinuses or middle ear, and individual or genetic susceptibility. These possibilities don't mean that every weather-related headache has the same mechanism, or that a forecast can identify the cause of an individual attack.
Altitude changes can feel different from ordinary daily weather. Flying, traveling through mountainous areas, or moving between climate zones may expose you to faster environmental shifts than you usually experience at home. Humidity, wind, temperature changes, sleep disruption, stress, and hormonal changes can also overlap with a pressure event.
A 2024 review found that weather variables, including pressure, humidity, and wind, can be related to migraine attacks, but findings across studies remain inconsistent. It summarized weather effects as accounting for only about 20% of migraine attack patterns overall (2024 weather and migraine review).
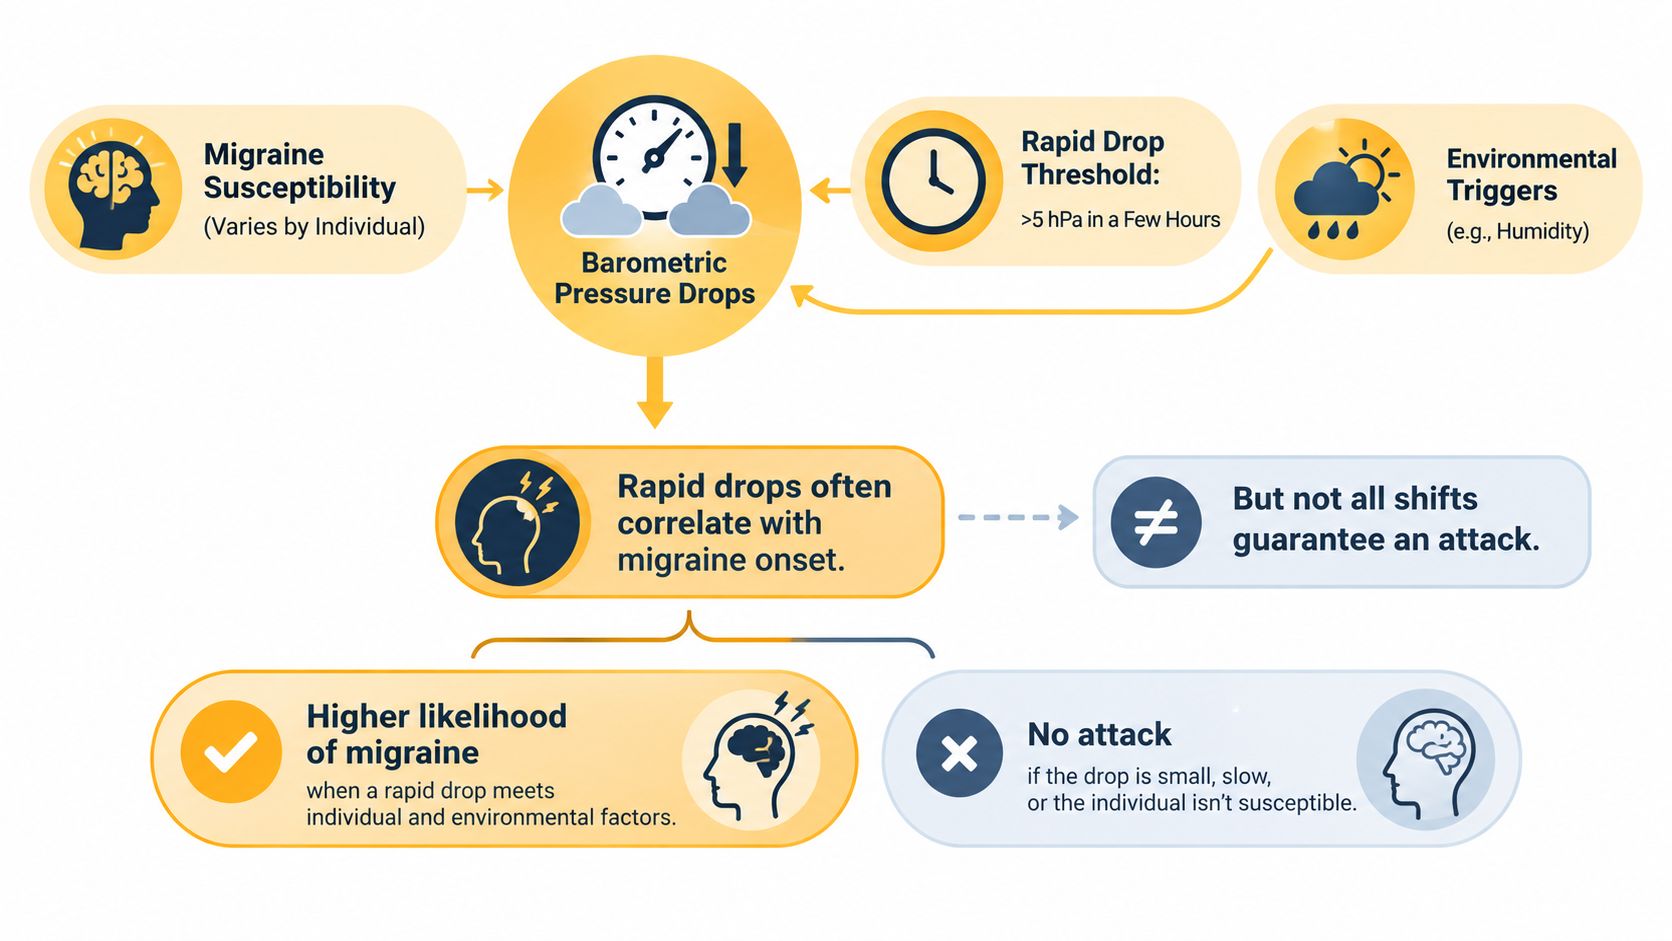
That's why your own pattern matters more than a universal rule. A falling pressure line may be one piece of your risk window, not a prediction that an attack must happen.
Turning a Forecast Into a Personal Pattern
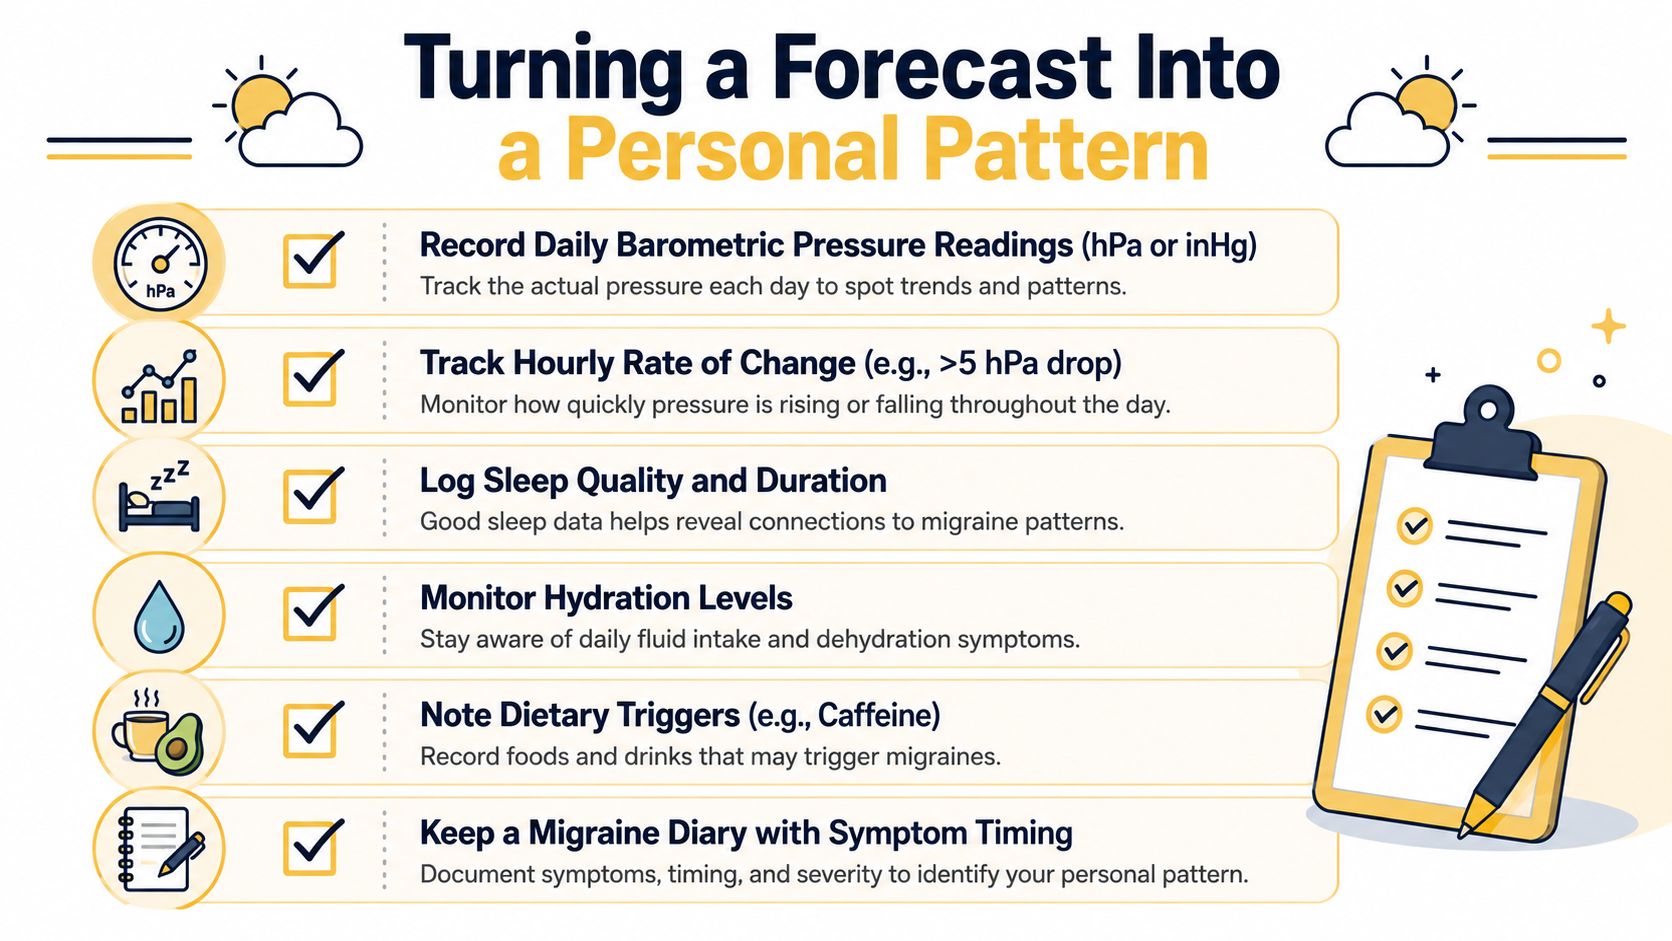
A forecast becomes more useful when you compare it with what your body does. A migraine diary can help you distinguish a pressure-linked pattern from a coincidence, especially when several triggers arrive together.
Track the same basic information each day for at least four to six weeks before drawing firm conclusions. You don't need a perfect record. Consistent timestamps are more valuable than long descriptions written after the fact.
What to record
- Pressure data: Note the local pressure reading and whether it is rising, falling, or steady.
- Rate of change: Record the hourly movement where available, including any drop greater than 5 hPa.
- Timing: Log when prodrome begins. Prodrome is the early phase before the main headache and can include fatigue, mood changes, food cravings, or neck stiffness.
- Migraine features: Record pain, aura if present, nausea, photophobia, meaning light sensitivity, phonophobia, meaning sound sensitivity, and postdrome symptoms.
- Daily context: Add sleep quality, hydration, meals, caffeine, stress, illness, travel, and physical activity.
A pressure drop may precede symptoms by several hours, so matching timestamps matters. Compare the time the pressure began falling with the time your first symptom appeared, rather than marking only the day of the attack.
Run a calm experiment
If your forecast shows a familiar risk pattern, try a low-effort response that your healthcare provider has already discussed with you. You might protect a rest period, keep meals regular, drink fluids, reduce avoidable sensory strain, or adjust plans for strenuous outdoor activity.
Then record what happened. Did symptoms appear, and when? Did they remain mild, or develop into a migraine? Did the same pressure pattern occur on a day when you slept well and had no attack?
If your weather app allows data export, align its pressure readings with your migraine entries in a spreadsheet. Look for repeated thresholds, such as a particular rate of fall or a specific time lag. Avoid treating one successful or unsuccessful day as proof.
Your records may show that pressure matters only when paired with poor sleep or another stressor. That isn't a failed experiment. It's useful information about how your migraine pattern behaves.
Generic Weather Apps Versus Migraine Forecast Apps
A standard weather app is often the best place to view raw environmental data. It may show current pressure, forecast pressure, temperature, humidity, wind, and precipitation with dependable visual design. What it usually doesn't do is interpret the pressure curve as a migraine-specific risk window.
A migraine forecasting tool focuses on translation. Instead of asking you to inspect a graph, it may combine local pressure movement with humidity, temperature shifts, air quality, pollen, and your reported symptoms or triggers. That can make the output easier to use, although no tool can promise that an attack will or won't occur.
| Feature | Generic Weather App | Migraine Forecast App |
|---|---|---|
| Current pressure | Usually available as a raw reading | Usually shown as part of a health-focused view |
| Pressure direction | May show rising or falling arrows | May highlight the timing and strength of a change |
| Hour-by-hour risk | Usually not migraine-specific | Designed to surface a potential risk window |
| Other environmental signals | Temperature, rain, wind, and humidity are common | May combine weather with air quality, pollen, and personal records |
| Personalization | Limited to location and general preferences | Can use logged attacks, symptoms, and triggers |
| Best use | Checking the underlying forecast | Turning several signals into a planning cue |
Generic apps win when you want the broad weather picture. Migraine-specific tools can reduce the mental work of converting several environmental signals into a schedule decision.
Relief, for example, provides an hour-by-hour risk forecast using local weather and health information, including pressure dynamics, and lets you log attack details such as symptoms, triggers, and medications. You can read more about how a migraine forecast app approaches this type of planning.
The most practical setup may be complementary. Use a weather service to understand what the atmosphere is doing, then use a migraine tracker to compare that movement with your personal history. If the two disagree, treat the result as a prompt to observe, not an instruction to change medical treatment.
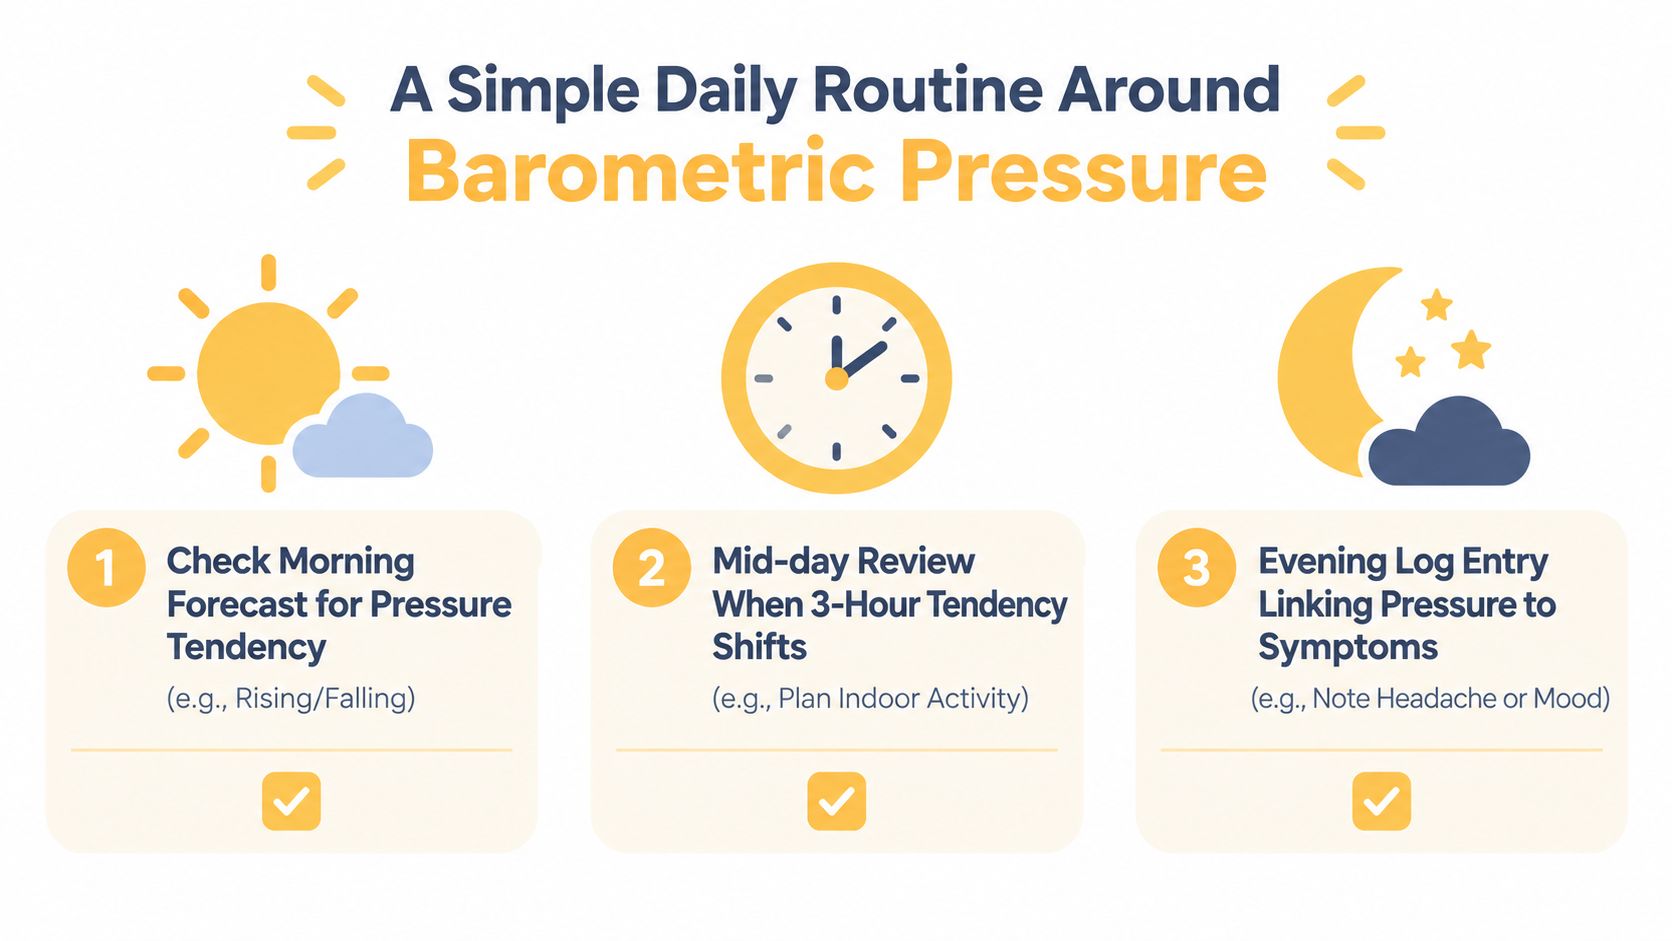
A Simple Daily Routine Around Barometric Pressure
A routine should still work on a pain-free day, when you have little patience for complicated tracking. Three brief check-ins can be enough to connect the forecast with your symptoms without turning weather into an all-day worry.
Morning check
Around 7 a.m., look at the next 24 hours. Note whether pressure is rising, falling, or steady, then identify the period with the sharpest expected movement. If that period overlaps with sleep, commuting, exercise, or a demanding work block, make a small adjustment rather than rebuilding your entire day.
Keep water available, plan regular meals, and protect rest if those habits already support your migraine management. If you use a clinician-approved treatment plan, follow that plan rather than inventing a new response based on an app alert.
Midday review
At lunchtime, check whether the observed three-hour tendency has changed from the morning forecast. A new falling trend may be a reason to choose a quieter environment, move strenuous outdoor activity indoors, or leave space between meetings.
You don't need to respond to every fluctuation. The purpose is to notice a pattern early and reduce avoidable strain, not to spend the day monitoring a number.
Evening log
At bedtime, record the pressure trend alongside your symptoms. Note whether you experienced a headache or migraine, aura, nausea, dizziness, light or sound sensitivity, or a postdrome period. Cleveland Clinic distinguishes migraine from an ordinary headache and describes migraine as a neurological condition that may include nausea, vomiting, light and sound sensitivity, dizziness, and vision changes (Cleveland Clinic explanation of barometric pressure headaches).
Seek immediate medical care for a sudden, severe headache, a headache with fever or a stiff neck, new neurological changes, or a headache after a head injury. Forecasting tools can support awareness and tracking, but they don't diagnose migraine or replace medical care.
Relief helps you connect local barometric-pressure changes and other environmental signals with hour-by-hour risk, while quick logs capture symptoms, triggers, and medications for personal pattern tracking. Visit Relief to explore a calmer way to understand your weather-sensitive migraine patterns.


