You're checking the weather before work, travel, or an outdoor appointment, but the question is more personal: which hours might be harder on your migraine? An hour by hour forecast for migraine risk gives you a time-stamped view of changing conditions and your likely sensitivity across the day. It isn't a diagnosis or a promise that an attack will happen. It's a planning tool that combines environmental signals with your own history so you can prepare with less uncertainty.
Migraine isn't a bad headache. An attack may include nausea, sensitivity to light or sound, dizziness, visual symptoms, or a draining recovery period. Because experiences vary widely, including episodic, chronic, vestibular, and hemiplegic migraine, a useful forecast needs to reflect more than rain and temperature.
Table of Contents
What an Hour by Hour Migraine Risk Forecast Actually Shows You
You have an important meeting in the afternoon. The daily weather summary says the day will be mild, but an hourly view shows temperature and pressure shifting around the time you need to commute home. An hour by hour migraine risk forecast helps you see that timing instead of compressing the entire day into one general label.
The forecast is a personalized, time-stamped estimate of likely migraine risk. It may display a curve, color scale, or score for each hour, alongside conditions such as temperature, humidity, wind, air quality, pollen, and barometric pressure. When personal logs are available, the system can compare those conditions with the times and symptoms you've recorded.
That makes it different from a standard weather forecast. Weather services describe the atmosphere. A migraine-risk view asks how those conditions may interact with your pattern.
Practical rule: Treat the forecast as an early-warning signal, not a verdict.
A higher-risk hour doesn't mean an attack is inevitable. A low-risk hour doesn't rule one out. Sleep disruption, stress, hormonal changes, food and drink, travel, illness, and many other factors can influence an attack, and triggers differ from person to person.
Why the timing can feel useful
A daily summary can't tell you whether the relevant change is expected before breakfast, during your commute, or after you've finished work. Hourly detail gives you a chance to make small adjustments, such as scheduling a demanding task during a calmer period, carrying your usual supplies, allowing recovery time, or choosing a quieter route.
You might also use the forecast when you're already noticing prodrome, the pre-headache phase that can include subtle warning signs. A forecast won't confirm that a migraine is starting, but it can encourage you to pay attention to changes you might otherwise dismiss.
Relief presents this kind of information by combining local environmental data with health check-ins and showing how risk may vary across the day. You can learn more about hourly migraine risk tracking with Relief without treating the app as a replacement for medical care.
This article is for informational purposes and is not medical advice. Consult a healthcare provider for personalized guidance.
Why Hourly Detail Matters More Than a Daily Summary
You check the daily forecast before leaving home. It says the day will be generally unsettled, but that label does not show whether the meaningful change arrives during your commute, at lunch, or after work. An hourly forecast turns that broad summary into a timeline you can use.
Migraine-related sensitivity may depend on when a variable changes, not only whether the day is warm, humid, windy, or unsettled overall. The timing can help you recognize a possible risk window and make a plan without treating the forecast as a prediction of an inevitable attack.
From a broad label to a usable timeline
The U.S. National Weather Service offers an Hourly Weather Graph for viewing the coming hours across the next seven days. Its format shows how detailed forecasts can support decisions about commuting, outdoor work, and health planning. The National Weather Service explains its hourly weather graph.
Read the timeline in three passes:
- Scan the whole day. Notice whether conditions rise, fall, or remain fairly steady before focusing on a single color or score.
- Mark fixed commitments. Note work, travel, exercise, childcare, appointments, and other plans that are difficult to change.
- Compare nearby and later hours. The closest hours usually provide more useful guidance for immediate choices. Later hours may change as new model runs arrive.
The technical systems behind these timelines also support retrospective review. Open-Meteo's historical archive includes hourly model output with global coverage from NOAA's GFS beginning on 2021-03-23, Germany's ICON global model beginning on 2022-11-24, and the U.S.-focused HRRR archive beginning on 2018-01-01. Linking successive model runs creates an hourly record that can support real-time planning and comparisons with your own symptom log. Explore Open-Meteo's historical weather API documentation.
What the daily view can hide
A daily summary may call conditions “stable” even while pressure changes gradually through the afternoon. It may show a general chance of rain without distinguishing a brief shower from several hours of wet, cool air.
Hourly detail cannot remove uncertainty. It gives you a more practical question: What is changing, and when do I need to respond? Over time, comparing those changes with your personal logs can make the forecast more useful as a migraine risk tool, rather than just another weather feature.
How Your Hour by Hour Forecast Is Generated
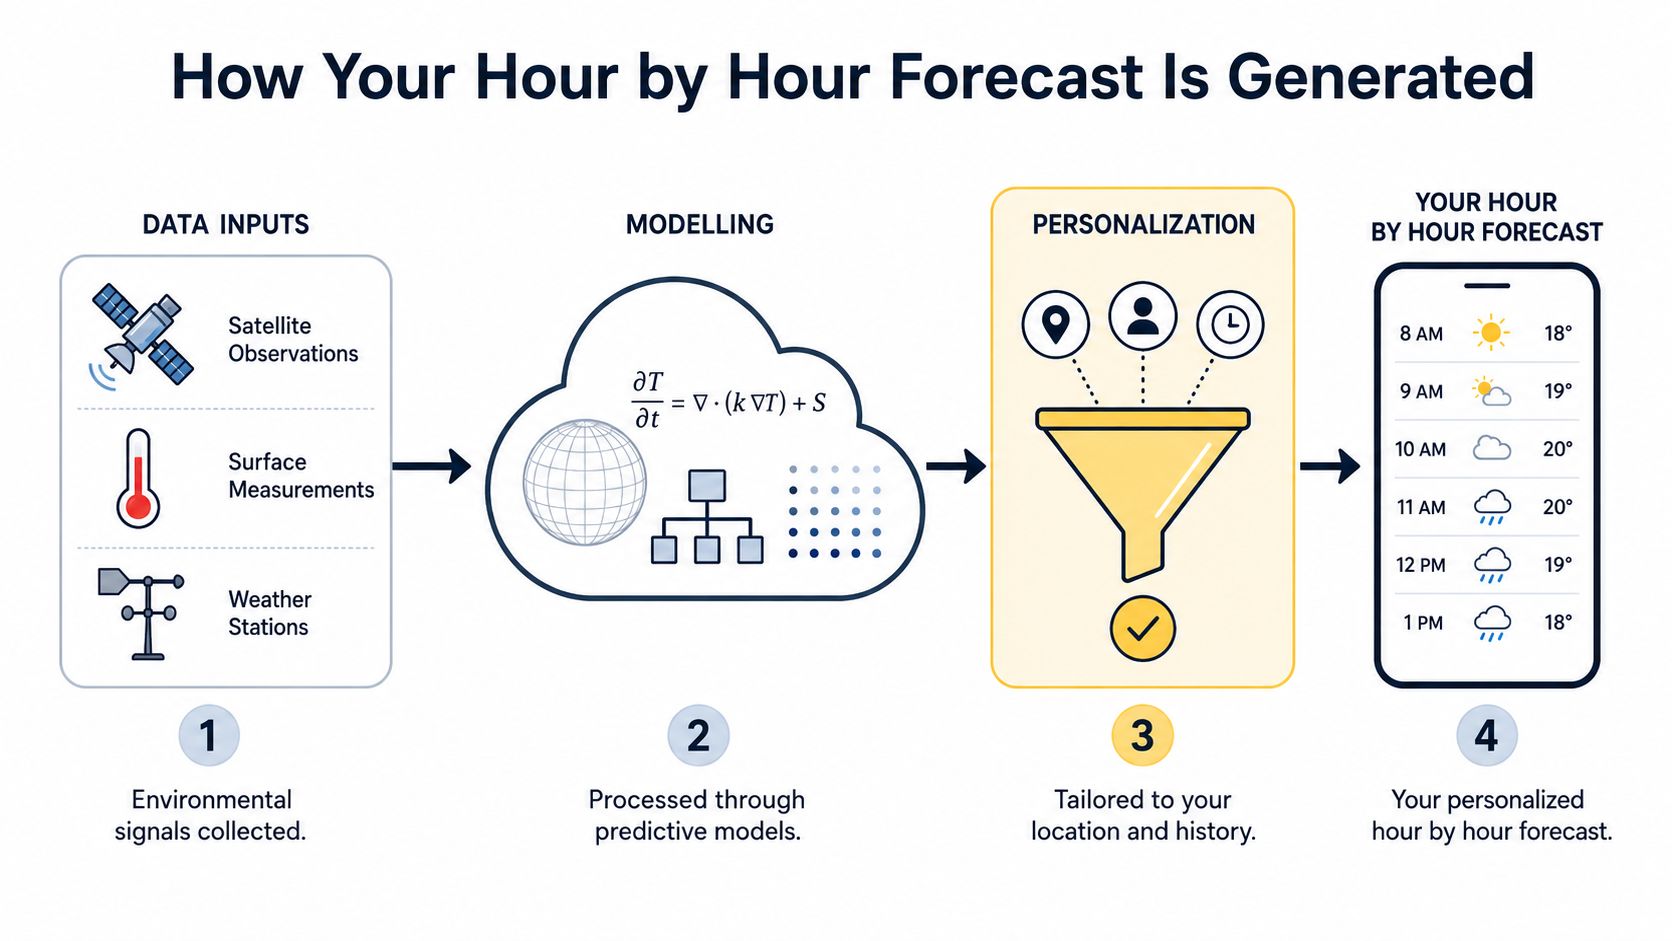
An hour by hour forecast typically combines three layers: environmental observations, weather modelling, and personal pattern recognition. Each layer answers a different question.
The first layer describes what's happening around you. Depending on the service, that can include temperature, humidity, wind, barometric pressure, air quality, pollen, and precipitation. These signals don't carry the same meaning for every person, so the forecast should show them as context rather than label one universal migraine trigger.
The second layer estimates how those conditions will evolve. Weather models process current observations and atmospheric measurements, then produce forecasts for future hours. Systems can stitch successive model runs into a continuous hourly sequence, which helps you see how conditions developed rather than relying on a single snapshot.
Why pressure change deserves attention
A pressure reading is an absolute value at one moment. A pressure trend describes movement over time. For some people with migraine, that movement may be more informative than the number shown on its own.
Recent migraine-focused guidance often discusses a drop of 6–10 hPa within 24 hours as a possible risk threshold, while emphasizing that the rate of barometric pressure change may matter more than the absolute pressure value. The same research area also notes that hourly precipitation remains difficult to predict and that extreme events are harder to forecast accurately. Read the migraine and weather discussion in the 2026 AI weather forecasting research.
Temperature has a stronger research signal than humidity in a recent systematic review and meta-analysis. The review found significant associations for temperature, OR 1.15, 95% CI 1.02–1.29, and ambient pressure, OR 1.07, 95% CI 1.01–1.15, while humidity was not significant overall, OR 1.04, 95% CI 0.97–1.11. These findings support displaying pressure and temperature shifts, but they don't prove that either variable causes an attack for every individual. Review the PubMed analysis of weather factors and migraine.
Where accuracy enters the picture
Forecast skill has improved substantially. Meteoblue reports that a 24-hour-ahead air-temperature forecast was about 70% accurate around 1980 and about 90% accurate by 2018. It also reports that a 72-hour forecast today performs comparably to the 24-hour forecast of 40 years earlier. See Meteoblue's weather-data accuracy benchmarks.
Its hourly benchmarks report temperature mean absolute error of 0.8°C at 12 hours ahead and 1.2°C at 24 hours ahead, with wind-speed hourly mean absolute error of 1.8 m/s at 24 hours ahead. In a global comparison across 475 stations, Meteoblue reports a second-place 24-hour temperature result of 1.29°C mean absolute error, compared with 1.26°C for the best provider. These are weather-forecast benchmarks, not guarantees about migraine prediction.
Personalization adds the third layer. A model can compare forecasted conditions with your logged attack times, symptoms, recent exposure, and medication records. Over time, that comparison may reveal that a specific combination, such as a pressure drop after poor sleep, is more relevant to you than humidity alone.
For additional detail about how a tracking product handles its role and data, review Relief's approach to migraine awareness and tracking.
How to Read Your Hour by Hour Forecast With Confidence
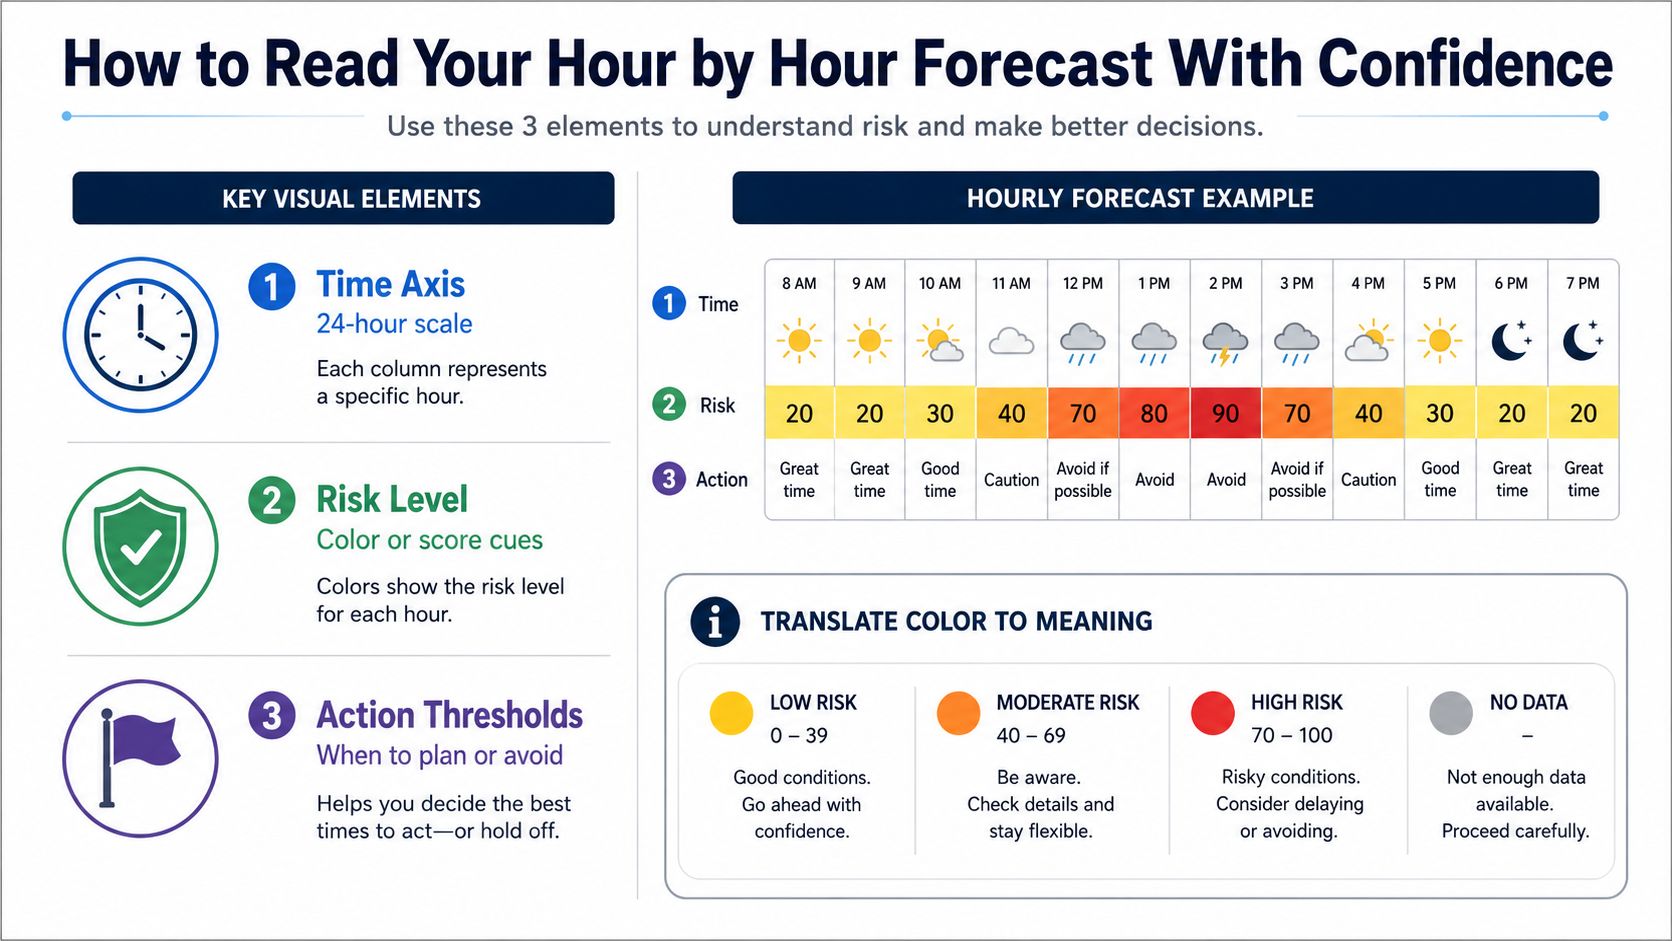
Start with the time axis. Identify the hours that matter to your actual day, then look at the risk pattern around them. A single high point may be less useful than a sustained rise that overlaps with commuting, bright outdoor exposure, or a night of shortened sleep.
Next, read the environmental signals behind the score. If the forecast highlights pressure change, temperature movement, air quality, or pollen, check whether the signal is changing quickly or merely remaining high. The interpretation should stay personal. A variable that appears repeatedly before your attacks deserves more attention than one that has never aligned with your diary.
Use confidence as a range
Major weather APIs commonly provide hourly forecasts beginning at the current hour and extending from 48 hours to 240 hours or more, depending on the provider and license. One widely used API returns up to 240 forecast hours by default, while another offers 10 days of hourly data with a time-window parameter. Review the hourly forecast API documentation from Weather.com.
That length is useful for planning, but it doesn't make every future hour equally reliable. Verification data reports 70% accuracy for next-day hourly forecasts in 2025 from one major provider, while an independent comparison found next-hour temperature predictions matched across apps more than 71% of the time. Those figures suggest that a forecast should communicate uncertainty rather than present one precise number as certainty. Read the forecast-accuracy comparison from the Japan Weather Association.
| Time Horizon | What to Expect | How to Use It |
|---|---|---|
| Next few hours | Usually the most actionable view, though errors remain possible | Prepare for a planned activity and watch for changes |
| Later today | Useful for identifying broad rises, falls, or changing conditions | Build flexibility into demanding tasks and travel |
| Following days | Helpful for general planning, with more uncertainty in exact timing | Use as an early planning signal, then check again closer to the event |
Turn colors into decisions
Avoid treating a color as an instruction. Give each level a personal meaning based on what you can reasonably do.
- Low or steady risk: Keep your plans, while maintaining ordinary routines that support you.
- Rising risk: Prepare your usual coping options, reduce avoidable strain, and protect time around the change.
- High or uncertain risk: Consider a flexible schedule, identify a quieter space, and avoid making the forecast your only basis for a major health decision.
A rising trend deserves more attention than a dramatic-looking single hour.
A forecast becomes more trustworthy when several signals agree, such as a pressure change appearing alongside a temperature shift and a pattern you've logged before. If different weather sources disagree, treat that disagreement as uncertainty and avoid overinterpreting a small difference.
Using Your Hour by Hour Forecast to Plan Your Day
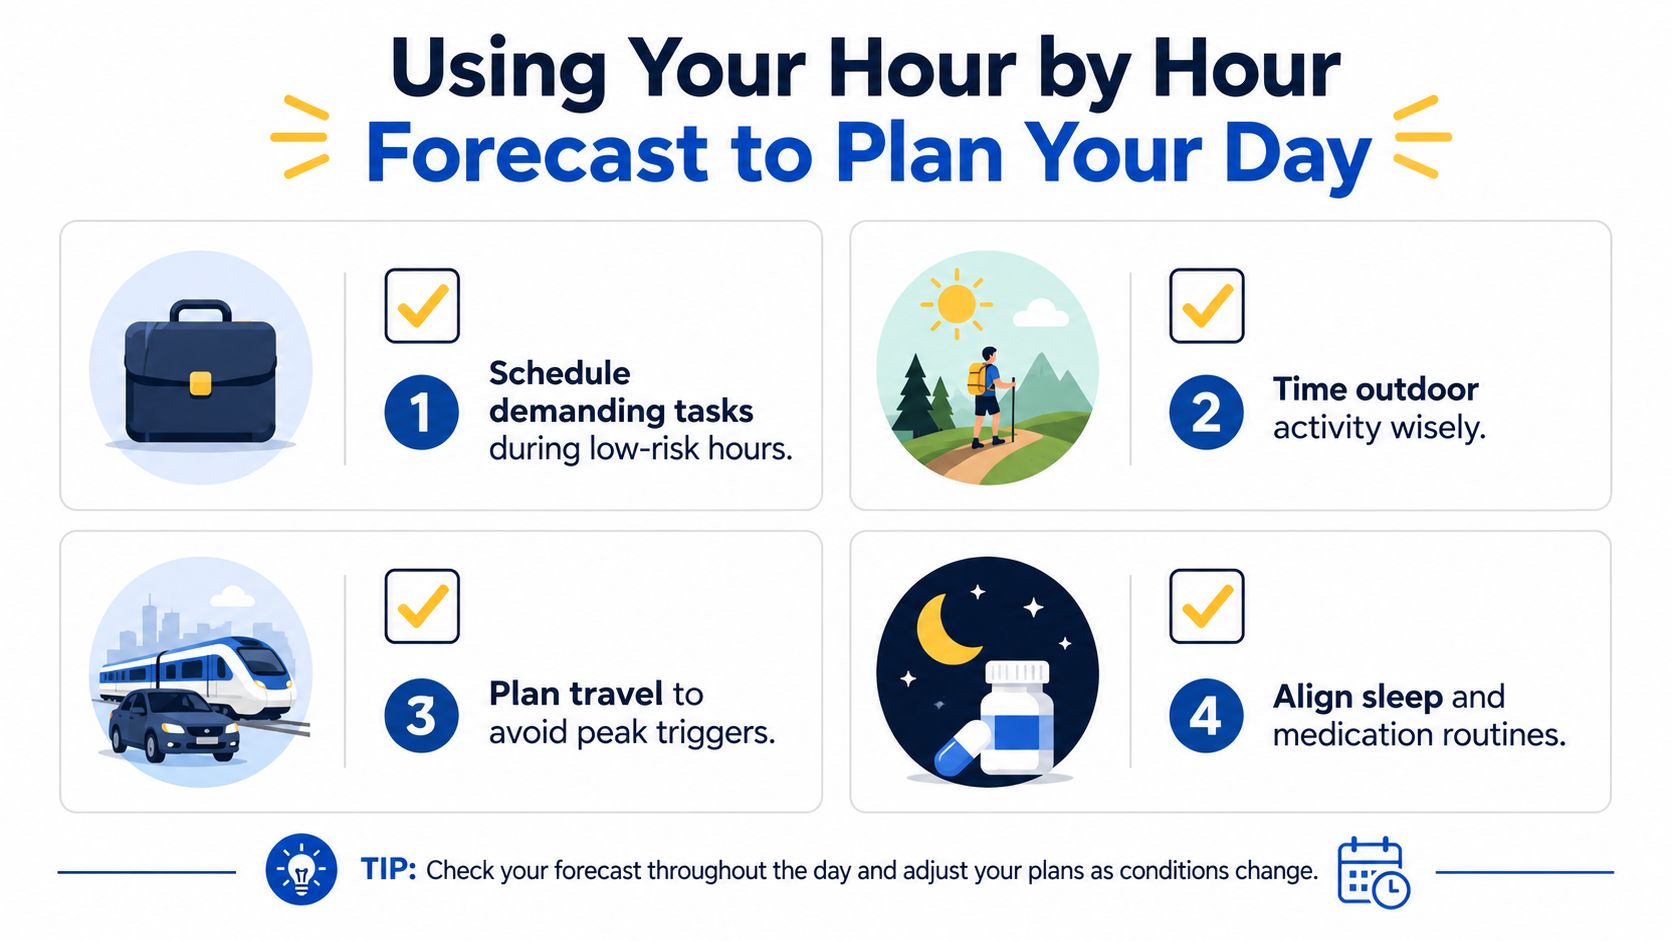
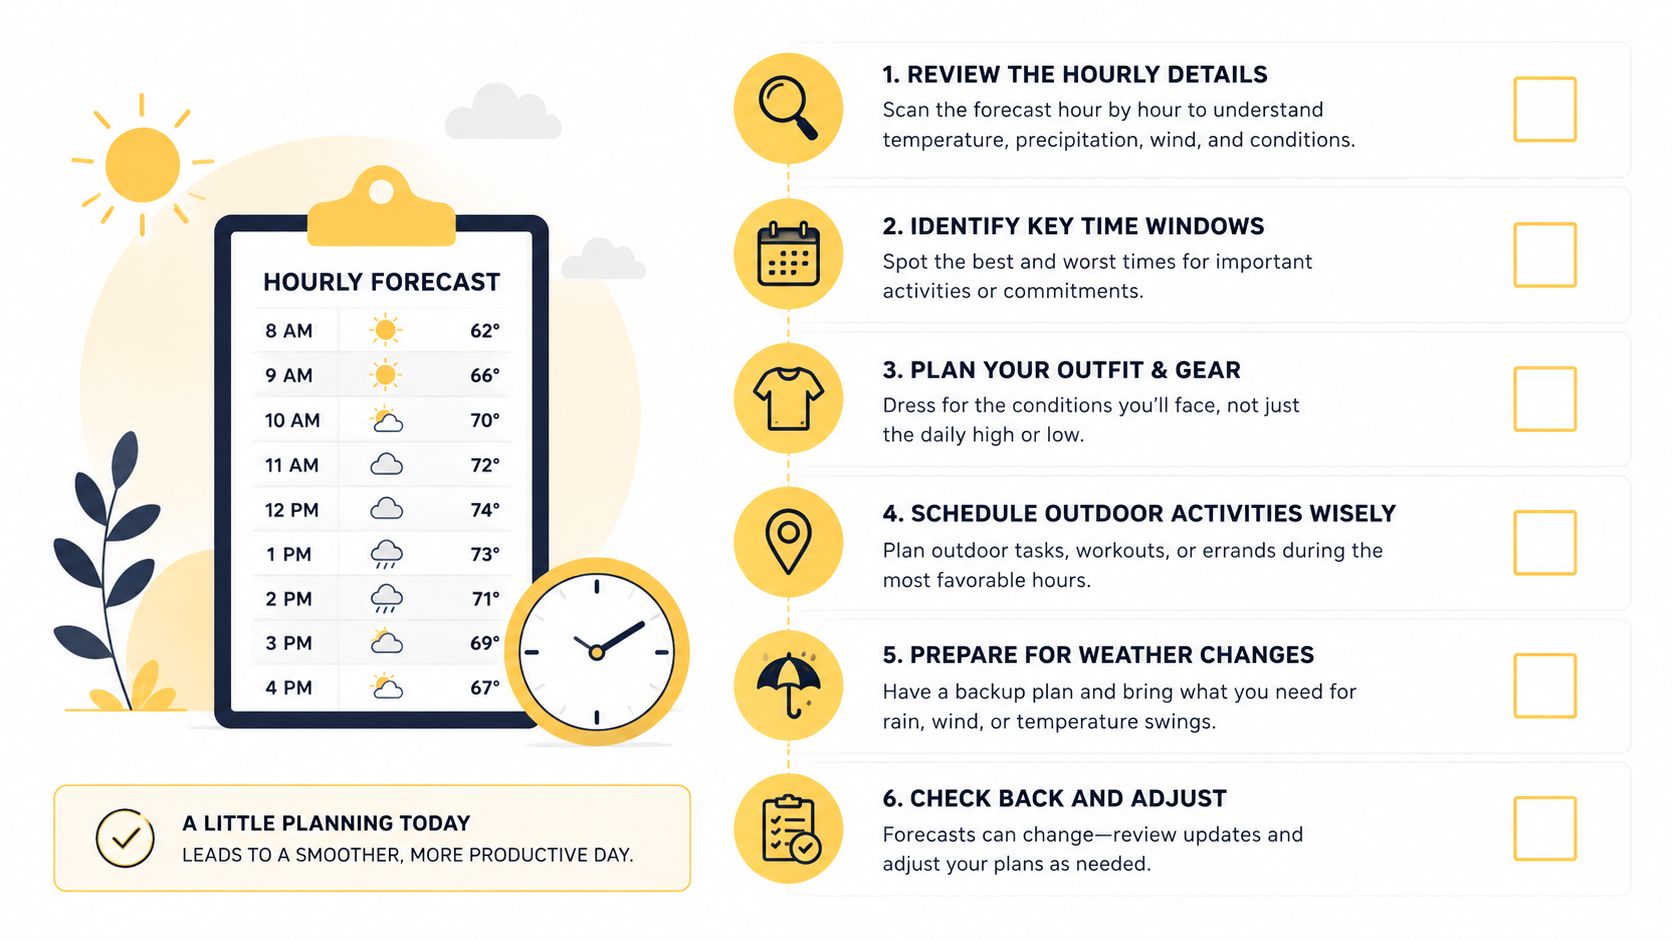
The most useful forecast is one that changes a practical choice without forcing you to reorganize your entire life. You don't need to cancel every activity when risk rises. You can create options.
Suppose your risk curve rises during the afternoon and you have a presentation scheduled late in the day. If moving it earlier is realistic, that may reduce pressure on a difficult period. If it isn't movable, prepare a lower-stimulation recovery space, plan a route with fewer delays, and keep your schedule lighter afterward.
Match the forecast to the task
Use the signal as a prompt for preparation, not proof of what will happen.
- For demanding work: Place concentrated tasks in hours that look steadier when you can, and protect short pauses before the risk curve rises.
- For outdoor activity: Check temperature, pressure movement, air quality, pollen, and glare-related conditions rather than relying only on rain.
- For travel: Build buffer time around the hours when several environmental signals shift, especially if travel already disrupts sleep or meals.
- For sleep: Watch the evening trend and keep your bedtime routine as consistent as your circumstances allow.
- For medication routines: Follow your healthcare provider's instructions and use the forecast only as a planning reminder. Don't change a treatment plan based solely on an app score.
A diary can help you test whether these adjustments matter. If you repeatedly prepare during a pressure drop and still see no change in your attacks, that signal may not be important for you. If the same environmental change appears alongside poor sleep and early prodrome, the combination may deserve discussion with a healthcare professional.
Know when forecasting isn't enough
Seek immediate medical care for a sudden severe headache, a headache with fever or stiff neck, new or unusual neurological changes, or a headache after a head injury. These symptoms need urgent assessment, regardless of what the weather forecast says.
This article is for informational purposes and is not medical advice. Consult a healthcare provider for personalized guidance.
How Tracking Makes Your Future Forecasts More Personal
A forecast can only learn from information that you record clearly enough to compare. “Bad headache this week” is difficult to connect with an environmental change. A start time, end time, symptom pattern, and recent exposure create a much more useful record.
The Migraine Trust recommends logging the date, day of the week, duration, severity, associated symptoms, medication taken, and whether a second dose was needed. Relevant symptoms can include dizziness, vertigo, and sensitivity to light, sound, or smells. Use the Migraine Trust headache diary guidance.
Keep the log specific but manageable
Try recording these details close to the event:
- Timing: Note when prodrome, aura, head pain, and postdrome begin and end. Aura means temporary neurological symptoms, often visual or sensory. Postdrome is the after-effect period when you may feel drained.
- Symptoms: Record nausea, light sensitivity, sound sensitivity, dizziness, vertigo, visual changes, or other symptoms instead of writing only “migraine.”
- Severity: Use the same personal scale each time so one entry can be compared with another.
- Treatment: Record what you took and whether you needed a second dose, without changing medication use outside your clinician's guidance.
- Prior exposure: Include sleep, stress, travel, weather changes, food and drink, and hormonal changes during the prior 24 hours. Headache diary guidance from Hartford HealthCare includes these environmental and behavioral factors alongside attack start and end times. Review the Hartford HealthCare headache diary guide.
Over time, tracking can show an exposure hit rate, meaning how often an attack followed a particular condition in your own records. Trend analytics can also reveal whether attack timing, duration, severity, or migraine-free streaks are changing.
Privacy matters when health information is involved. Read Relief's privacy information before deciding what you want to record and share.
What to Expect Next and How to Stay One Step Ahead
An hour by hour forecast can make a vague concern more concrete. It helps you notice when conditions are changing, compare those changes with your own history, and create flexible plans for work, travel, rest, and recovery.
It won't predict every migraine. Accuracy varies by forecast horizon, location, weather pattern, and the quality of your personal records. Your experience may also differ depending on whether attacks are episodic or chronic, with aura or without aura, or associated with vestibular, hemiplegic, or other migraine features.
Use forecasting alongside appropriate medical care, not instead of it. Relief is a tracking and awareness tool, not a migraine treatment, and it can't diagnose you or replace a healthcare provider's advice.
This article is for informational purposes and is not medical advice. Consult a healthcare provider for personalized guidance.
Start with consistent, brief logging. Review your migraine-free streaks, average attack time, symptom patterns, and changing severity with a clinician when useful, and let your own records guide which forecast signals deserve attention.
Relief combines local weather, air quality, pollen, and your symptom logs into an hour-by-hour view of possible migraine risk. Visit Relief to start tracking the conditions and patterns that matter to your day.


