Barometric pressure today matters less for migraine risk than how fast it changes. A reading near the standard 1013.25 hPa, or 29.92 inHg, can be less useful than a noticeable fall or rise across the next several hours.
You may know the feeling: you wake with head pain, light feels harsh, and a storm is still somewhere beyond the horizon. Later, your weather app shows the pressure dropping, confirming what your body seemed to notice first. That experience can be frustrating, especially when people dismiss it as “just weather.”
Pressure sensitivity is real for some people, but it isn't universal, and migraine isn't the same as an ordinary headache. A migraine attack can include throbbing or pulsing pain, nausea, photophobia (light sensitivity), sound sensitivity, or aura, temporary neurological symptoms such as visual changes or tingling. The attack may also have a prodrome, an early phase before pain, and a postdrome, the drained or foggy period afterward.
The most useful question usually isn't, “What's the pressure right now?” It's, “What has the pressure been doing, and does that pattern match my history?” This guide will help you understand the mechanics, identify your personal pattern, and use hourly information to make practical decisions before symptoms build.
This article is for informational purposes and is not medical advice. Consult a healthcare provider for personalized guidance.
Table of Contents
- Start with the tools you already have
- Use official services for a second view
- Add local hardware only if you'll use it
Why Barometric Pressure Today Feels Different When You Get Migraines
A weather-sensitive migraine can make your body feel like an unusually sensitive barometer. You might notice pressure behind the eyes, neck tension, dizziness, or familiar prodrome symptoms before a forecast shows rain. That doesn't mean every uncomfortable day is caused by pressure, and it doesn't mean the number on your phone predicts an attack with certainty.
The key distinction is between absolute pressure and pressure movement. Atmospheric pressure has a long-established sea-level reference of 1013.25 hPa, but people can experience migraine symptoms at different readings. For many, the relevant signal is a rapid fall, a rapid rise, or a larger swing layered with other exposures such as poor sleep, heat, humidity, wind, or air pollution.
A guide to temperature, humidity, and barometric pressure can help you see why weather rarely acts as one isolated trigger. Your nervous system may respond to a combination of changes rather than a single measurement.
Three questions to ask today
- What is changing? Look at the hourly curve instead of only the current reading.
- What happens in your own history? Compare pressure movement with pain onset, aura, nausea, sleep, and other symptoms.
- What can you adjust early? On a day that resembles a known pattern, protect sleep, hydration, meals, and recovery time where possible.
Research supports a cautious interpretation. A 2025 systematic review found that several studies connected pressure drops or rapid fluctuations with more frequent migraine attacks, while fewer found a relationship with severity and none found an association with attack duration (systematic review of barometric pressure and migraine). That means a falling trend may be useful for planning, but it isn't a diagnosis or a guarantee.
What Barometric Pressure Really Means
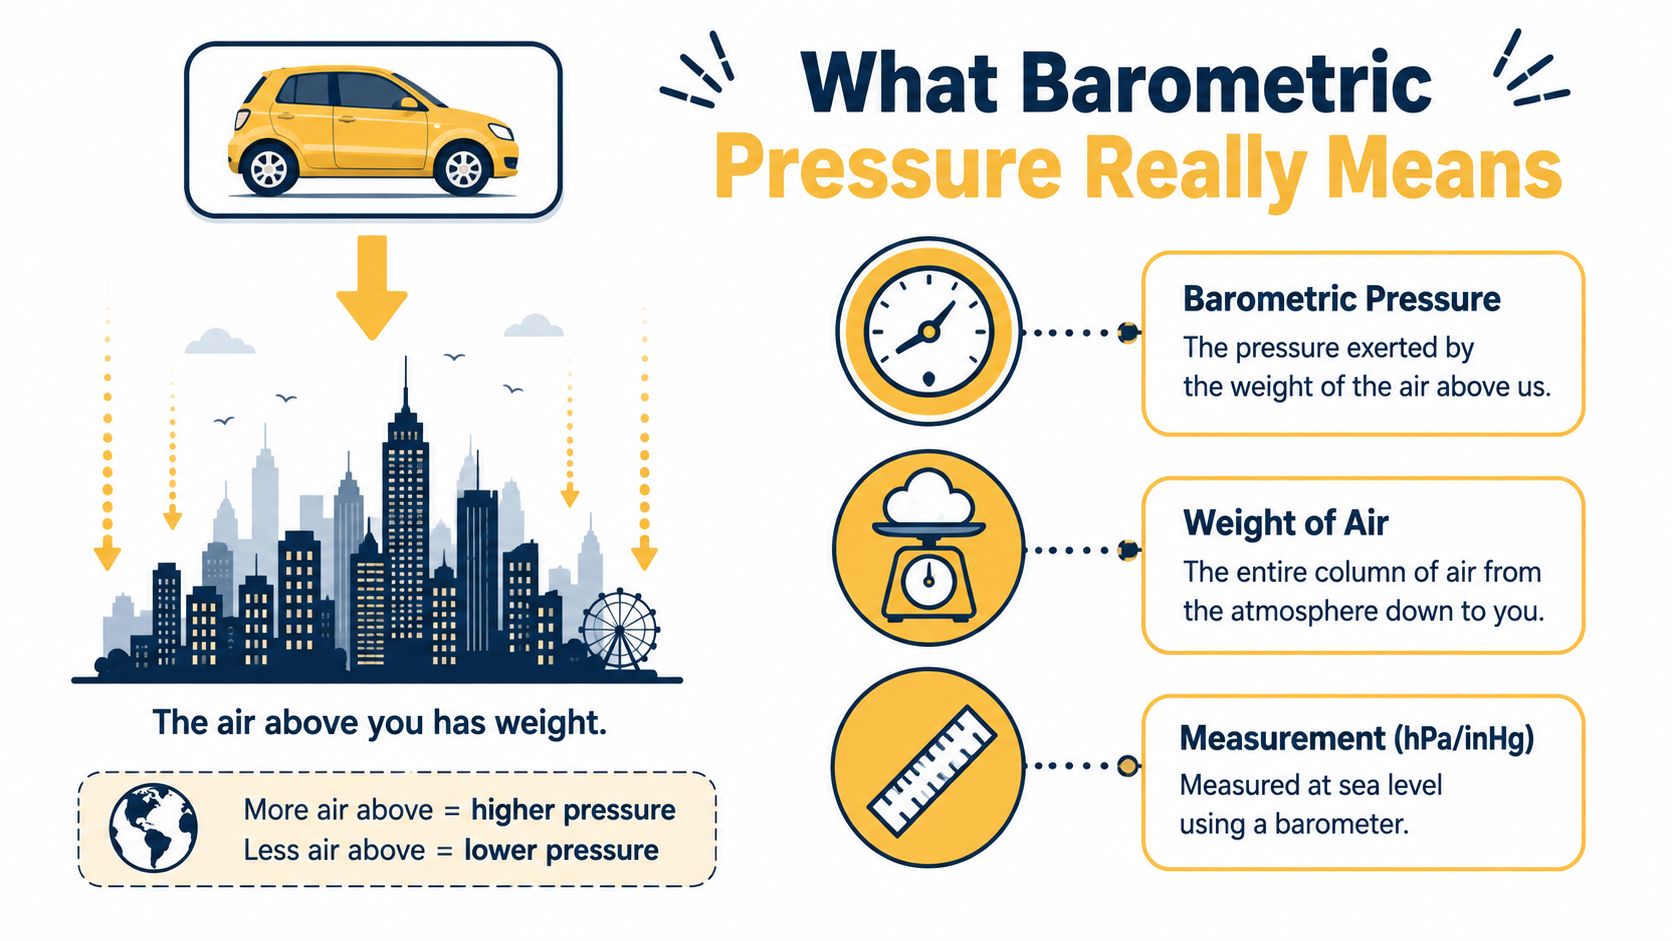
Barometric pressure is the force created by the weight of the air above you. A column of atmosphere reaches from the ground to the edge of space. Gravity pulls that column downward, so the air presses on the Earth and on every surface around you, much like water pressing against the sides of a container.
At sea level, the standard reference is 1013.25 hPa, equal to 29.92 inHg and about 14.7 psi. Meteorologists usually report pressure in hectopascals, or hPa. Some household barometers use inches of mercury, or inHg. The standard atmosphere was formally adopted in 1954 as 101,325 pascals, providing a shared baseline for weather, aviation, and scientific reporting (standard atmosphere and pressure reference).
Why the number moves
Weather systems move and redistribute air. Higher pressure often appears with more stable conditions, while lower pressure is common near unsettled weather and storms. A falling barometer can indicate an approaching low-pressure system, and a rising barometer often signals improving stability. For migraine tracking, the hourly direction may offer more useful context than today's isolated number.
Altitude changes the pressure you physically experience. At higher elevations, less air sits above you, so the raw pressure is lower than at sea level. Weather services often adjust readings to a shared sea-level reference, allowing comparisons between locations.
Record pressure consistently, note whether it is rising or falling, and do not compare an adjusted reading with an unadjusted one. Relief's hour-by-hour risk forecast can help connect those changes with your personal migraine pattern, turning raw pressure data into an earlier planning signal.
How Pressure Changes Can Trigger Migraine Attacks
Pressure changes may affect migraine through several overlapping pathways, but scientists haven't established one mechanism that explains every person's experience. A shift in surrounding pressure could influence air-filled sinus spaces, alter how tissues respond to changing forces, or interact with a nervous system already prone to migraine. The trigeminovascular system, a network involving the trigeminal nerve and blood vessels around the brain, plays a central role in migraine biology and may be sensitive to environmental changes.
The clearest practical signal is often the direction and speed of change. In a prospective study of 28 migraine patients, frequency increased when pressure fell by more than 5 hPa from the day of headache onset to the following day. 18 of 28 patients, or 64%, reported weather-linked migraine development, while the monthly mean pressure itself wasn't associated with headache frequency (prospective migraine and pressure study).
That finding doesn't establish a universal threshold. A separate study reported that migraine occurred most often when pressure decreased by 6 to 10 hPa relative to standard pressure, but its pooled analysis didn't show a significant overall association between weather variables and migraine events (study of atmospheric pressure and migraine). Evidence remains heterogeneous, so treat these values as possible comparison points, not medical rules.
A cautious way to read the change
| Pressure change over several hours | Typical reported effect | Risk tier |
|---|---|---|
| Small or stable movement | Often less informative than a clear trend | Lower information |
| Noticeable fall | May coincide with attacks for pressure-sensitive people | Personal-pattern dependent |
| Rapid or larger fluctuation | More likely to deserve attention if it matches your diary | Higher personal concern |
The important question is whether your symptoms repeatedly follow a similar curve. Some people notice attacks before storms, while others react to rising pressure or to a combination of pressure, humidity, temperature, and disrupted sleep. A 2024 review concluded that weather sensitivity affects some people with migraine but not everyone, and described recent findings as inconsistent (review of weather and migraine).
Don't treat an approaching storm as proof that an attack will happen. Treat a familiar pressure pattern as a prompt to check your other vulnerabilities and follow the plan you've already discussed with your healthcare provider.
Station Pressure Versus Sea Level Pressure
A home sensor on a mountain and a weather app in the same city can show different numbers for the same moment. Elevation often explains the gap, rather than a faulty device.
Station pressure is the air pressure measured at the sensor's actual location. Higher elevations have less atmosphere above them, so station pressure is lower. Mean sea-level pressure, often labeled MSLP or QNH, adjusts that reading mathematically to a shared sea-level reference. Forecasters use the adjusted value to compare weather systems across locations.
Side-by-side comparison
| Feature | Station pressure | Sea-level pressure |
|---|---|---|
| What it shows | Actual pressure at the sensor's elevation | Pressure adjusted to a shared sea-level reference |
| Best use | Local instrument and elevation monitoring | Comparing weather systems between locations |
| Common display | Dedicated sensors, some indoor weather stations | Weather apps, forecasts, aviation reports |
| Main limitation | Readings vary strongly with altitude | It isn't the raw pressure at your exact elevation |
A high-elevation sensor might show roughly 840 hPa, while a report for that same moment lists around 1013 hPa after sea-level adjustment. The readings are not automatically contradictory. One describes pressure where the sensor sits, while the other provides a common comparison point.
The National Weather Service explains that pressure reported in weather broadcasts is generally an altimeter setting reduced to mean sea level, not true station pressure at a specific elevation. This distinction helps when comparing a home sensor with an app.
For migraine tracking, the hourly trend and your personal pattern matter more than finding one perfect number. Relief's hour-by-hour risk forecast can help connect changing pressure conditions with your own decisions, while a diary shows whether that connection repeats. Record whether your source uses station pressure or sea-level pressure, then keep that measurement type consistent over time.
Where to Find Barometric Pressure Today for Your Location
You can check local pressure in a few minutes, but the best source depends on whether you want a quick forecast or a detailed personal record. Start with the easiest option and increase precision only if the data helps you identify a repeatable pattern.
Start with the tools you already have
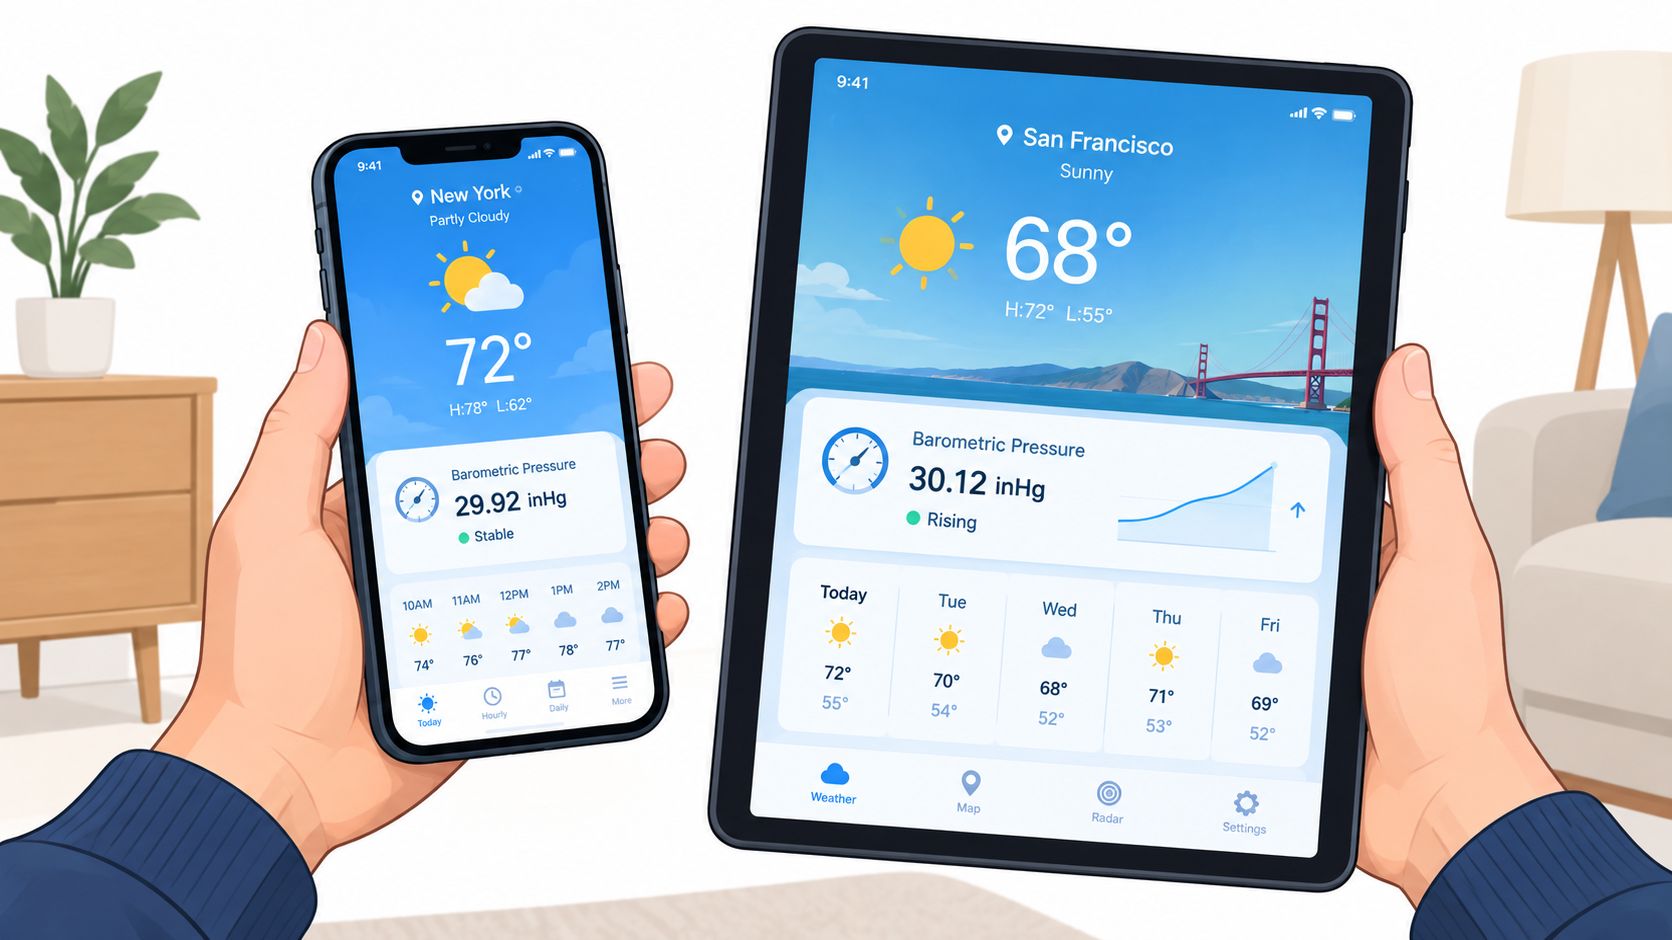
The built-in Weather app on iOS and the Google Weather widget on Android may show atmospheric pressure alongside temperature, wind, and precipitation. Look for a pressure card or expand the hourly forecast. If the app offers a graph, focus on the slope and not only the current value.
A dedicated app can be useful if you want pressure in hPa, inHg, or a more visible trend line. Barometer Plus, Weather Underground, and WunderMap are examples of tools that may provide more detailed station information, depending on your location and device. Check whether the displayed value is station pressure or sea-level pressure before adding it to a diary.
Use official services for a second view
National weather services such as NOAA, the Met Office, and Environment Canada provide established observation and forecast data. These services can help you verify an unusual reading or see the broader pressure system affecting your area.
For migraine-specific context, a barometric pressure headache map may help you think geographically about weather patterns, but your own symptom history remains more relevant than a regional label.
Add local hardware only if you'll use it
A home barometer or indoor weather station can capture conditions close to you. Products such as Netatmo, Davis, and Ambient Weather may provide local measurements and historical charts. A sensor won't make the reading clinically predictive, but it can reduce confusion when nearby weather stations differ.
GPS-enabled apps can improve sea-level conversion by accounting for elevation. Be cautious with a generic search for “barometric pressure today,” because the result may represent a regional average rather than the conditions at your location.
Reading Hourly Pressure Trends Instead of a Single Number
A current reading is a snapshot. An hourly chart is a short story.
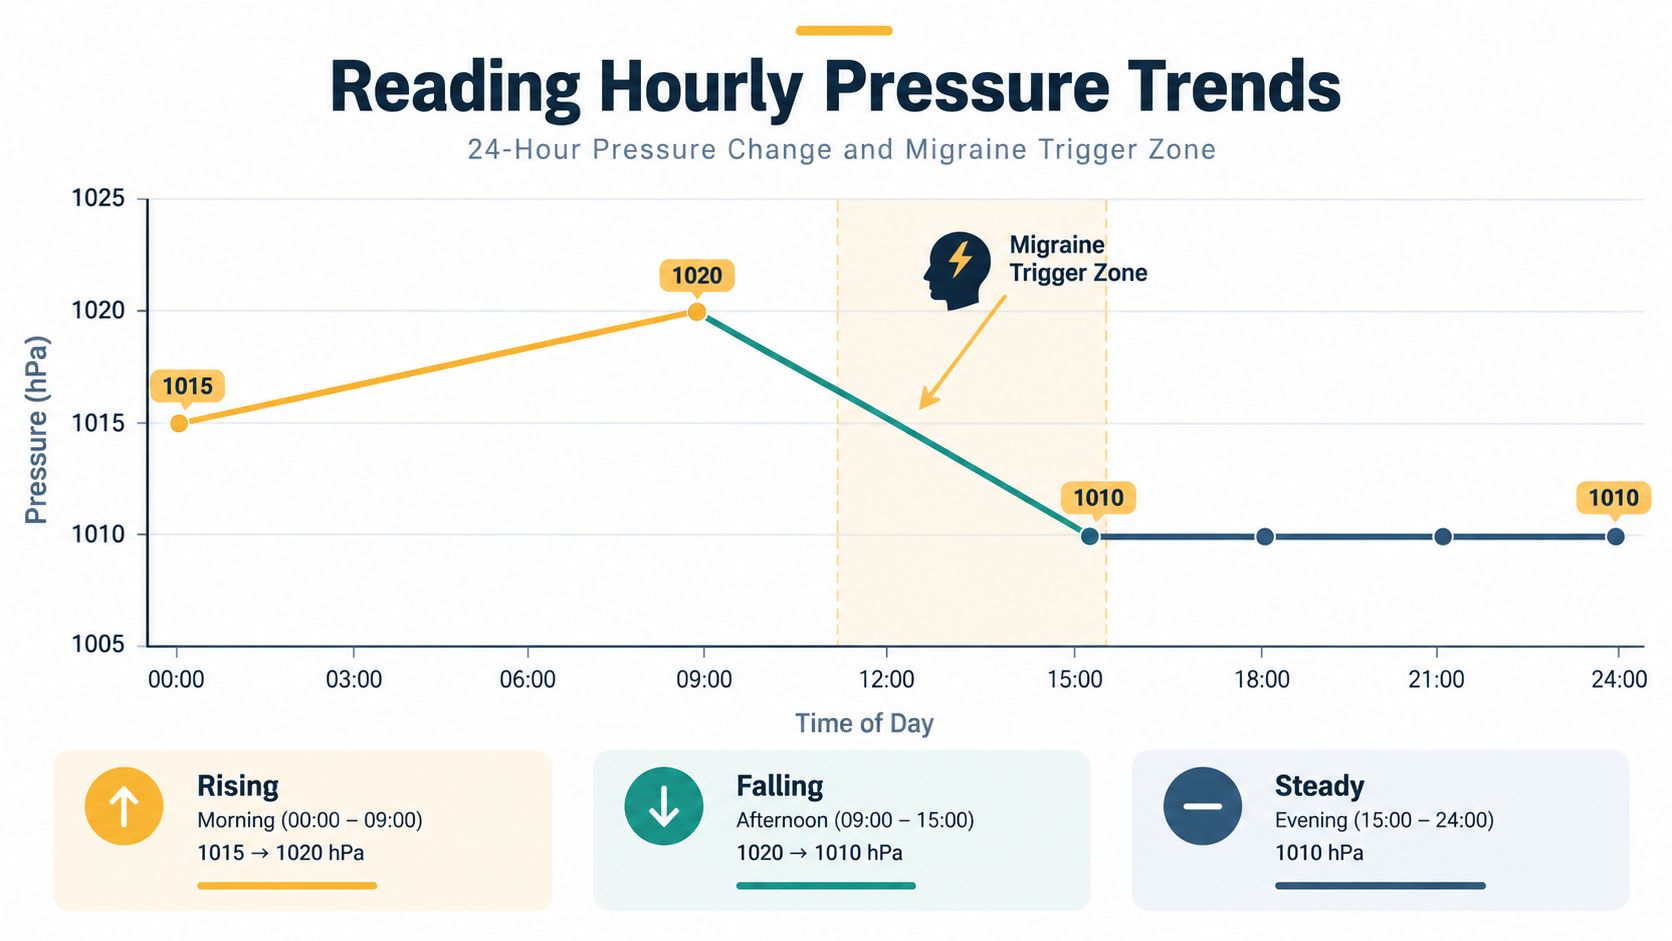
Look for three features: whether the line is rising, falling, or steady, how quickly it moves in hPa per hour, and the total swing across the day. A gentle drift may matter less to you than a sharp bend, even if both end at the same final pressure.
Some migraine diaries show more entries after a fall of 3 to 5 hPa over a few hours or a cumulative fall of 7 to 10 hPa over 24 hours, but these are not universal clinical cutoffs. The available research is inconsistent, and a 2025 meta-analysis found an association between ambient pressure and migraine attacks with an odds ratio of 1.07, with a 95% confidence interval of 1.01 to 1.15, while a Japanese multi-region study found no association between seasons with substantial atmospheric pressure change and migraine onset (meta-analysis and Japanese study context).
Read the curve in context
- Rising: Some people report symptoms during rising pressure, so don't assume only a fall matters.
- Falling: A quick decline may deserve attention if it has appeared before your attacks.
- Steady: Stable pressure can still coincide with migraine when other triggers are present.
Relief's hour-by-hour forecast uses the same practical idea, translating changing environmental signals into time-based risk information rather than leaving you with one isolated digit. The useful output isn't certainty. It's a clearer prompt to notice when your pattern may be developing.
Turning Pressure Data Into a Personal Migraine Plan
A useful plan starts with observation, not assumptions. Record your pressure source, the hourly trend, symptoms, sleep, meals, hydration, stress, temperature, humidity, wind, air quality, and any medication you take as prescribed. A consistent diary can show whether pressure is a recurring factor or appears alongside another exposure.
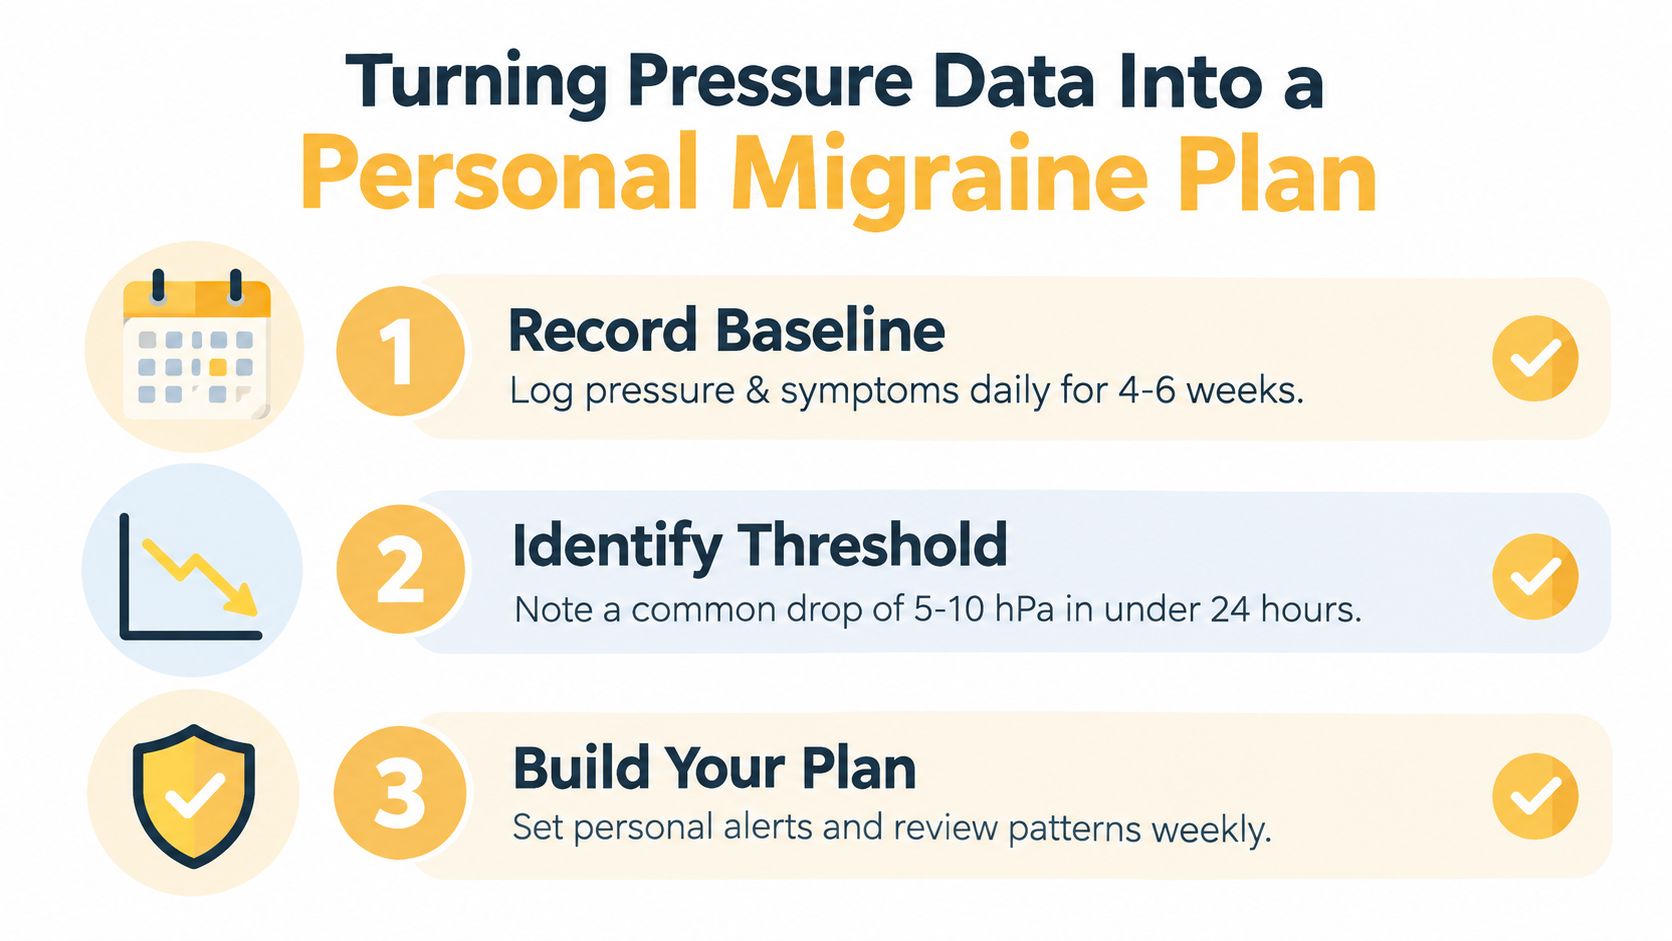
Build your record in three stages
- Record a baseline. Track daily conditions and symptoms for 4 to 6 weeks. Note the time pain or aura begins, severity, associated symptoms, and when the attack ends.
- Identify a possible threshold. Look for repeated patterns, such as a fall of 5 to 10 hPa over less than 6 hours or across less than 24 hours. These values can guide questions for your clinician, but they don't predict every attack.
- Create a response plan. If a familiar trend appears, protect regular sleep, meals, fluids, and manageable activity. Follow any preventive or acute treatment plan provided by your healthcare professional. Don't change medication timing or treatment without asking them.
A simple diary entry might read: “Pressure falling from morning to afternoon, poor sleep, visual aura at midday, pain began later, nausea present, treatment taken according to plan.” Over time, compare entries with the hourly curve instead of relying on memory. Review the pattern regularly and discard a suspected trigger if it doesn't keep matching your symptoms.
Pressure may also be only one part of the environmental picture. A 2026 population-based study of 7,032 adults with migraine associated short-term nitrogen dioxide and solar radiation exposure with increased emergency migraine-related encounters, while weekly heat and humidity patterns modified pollution-related risk (population-based environmental exposure study). That supports a broader approach: pressure may lower your threshold, while other conditions help determine whether an attack begins.
Safety check: Seek immediate medical care for a sudden, severe headache, a headache with fever or stiff neck, new neurological changes, or a headache after a head injury.
Watch this educational overview for another way to think about pressure tracking and migraine planning:
Relief lets you log symptoms, triggers, and medications alongside local weather signals, including barometric pressure, so you can compare your own history with hourly changes and review patterns over time. Visit Relief to start tracking the pressure trends and symptoms that matter to you.


