
You wake up with a migraine and immediately start searching for a reason. Was it poor sleep, stress, a meal, or the weather? Environmental exposure assessment offers a more precise way to investigate. It measures what you're exposed to, for how long, and under which conditions, then connects those exposures with your personal migraine records.
This doesn't mean every weather shift or air-quality reading causes an attack. Migraine is a neurological disease with highly individual patterns, and migraine triggers can vary between people and even from one attack to another. But the same environmental science used by the World Health Organization's air-pollution surveillance system can help you move from guesswork toward useful personal observations.
Table of Contents
Why Your Environment Might Be Triggering Your Migraines
You go to bed feeling fine, then wake with throbbing pain, nausea, or photophobia, the medical term for sensitivity to light. You check yesterday's food, replay your schedule, and wonder why no obvious trigger stands out. That uncertainty can feel especially frustrating when people reduce your migraine to “just stress” or “something you ate.”
Environmental conditions may be part of the picture. Changes in humidity, temperature, air pollution, sunlight, and other surroundings can occur alongside your usual biological and behavioral factors. An exposure assessment doesn't prove that one factor caused your migraine. Instead, it helps you ask a better question: What conditions were present before the attack, and did the same pattern appear more than once?
From a vague feeling to measurable exposure
Environmental exposure assessment quantifies who encountered an agent, what the agent was, how long contact lasted, and under what conditions it happened. Researchers use this approach to study pollution and health across populations, while you can apply the same logic to your own daily records.
The approach is established public-health science, not a fringe explanation for unexplained symptoms. WHO combines ground measurements, satellite retrievals, chemical transport models, and population data to estimate air-pollution exposure across all 194 WHO Member States. Its air-quality database has published ground measurements since 2011 and is updated every 2–3 years (WHO air-pollution data).
That global system measures population patterns. Your personal records add the missing context: where you were, when symptoms began, whether you were indoors or outside, and what else was happening that day.
A useful mindset: treat environmental data as evidence to compare with your migraine history, not as a list of automatic causes.
By the end of this guide, you'll know which environmental variables are worth tracking, why app-based forecasts have limitations, and how to discuss recurring patterns with a healthcare provider.
What Environmental Exposure Assessment Measures
A migraine begins during an ordinary day: you commute, work indoors, step outside, and later notice pressure building behind your eyes. Exposure assessment helps reconstruct that day by asking four connected questions:
- Who was exposed?
- What agent or condition was present?
- For how long and at what intensity?
- Where and under what circumstances did exposure occur?
The National Center for Biotechnology Information's overview of exposure assessment describes exposure as contact with an agent measured across time and conditions. A common shorthand is concentration multiplied by time. This resembles an environmental “dose,” but it is not a medication dose or a direct medical measurement. It is a way to describe how much contact occurred.
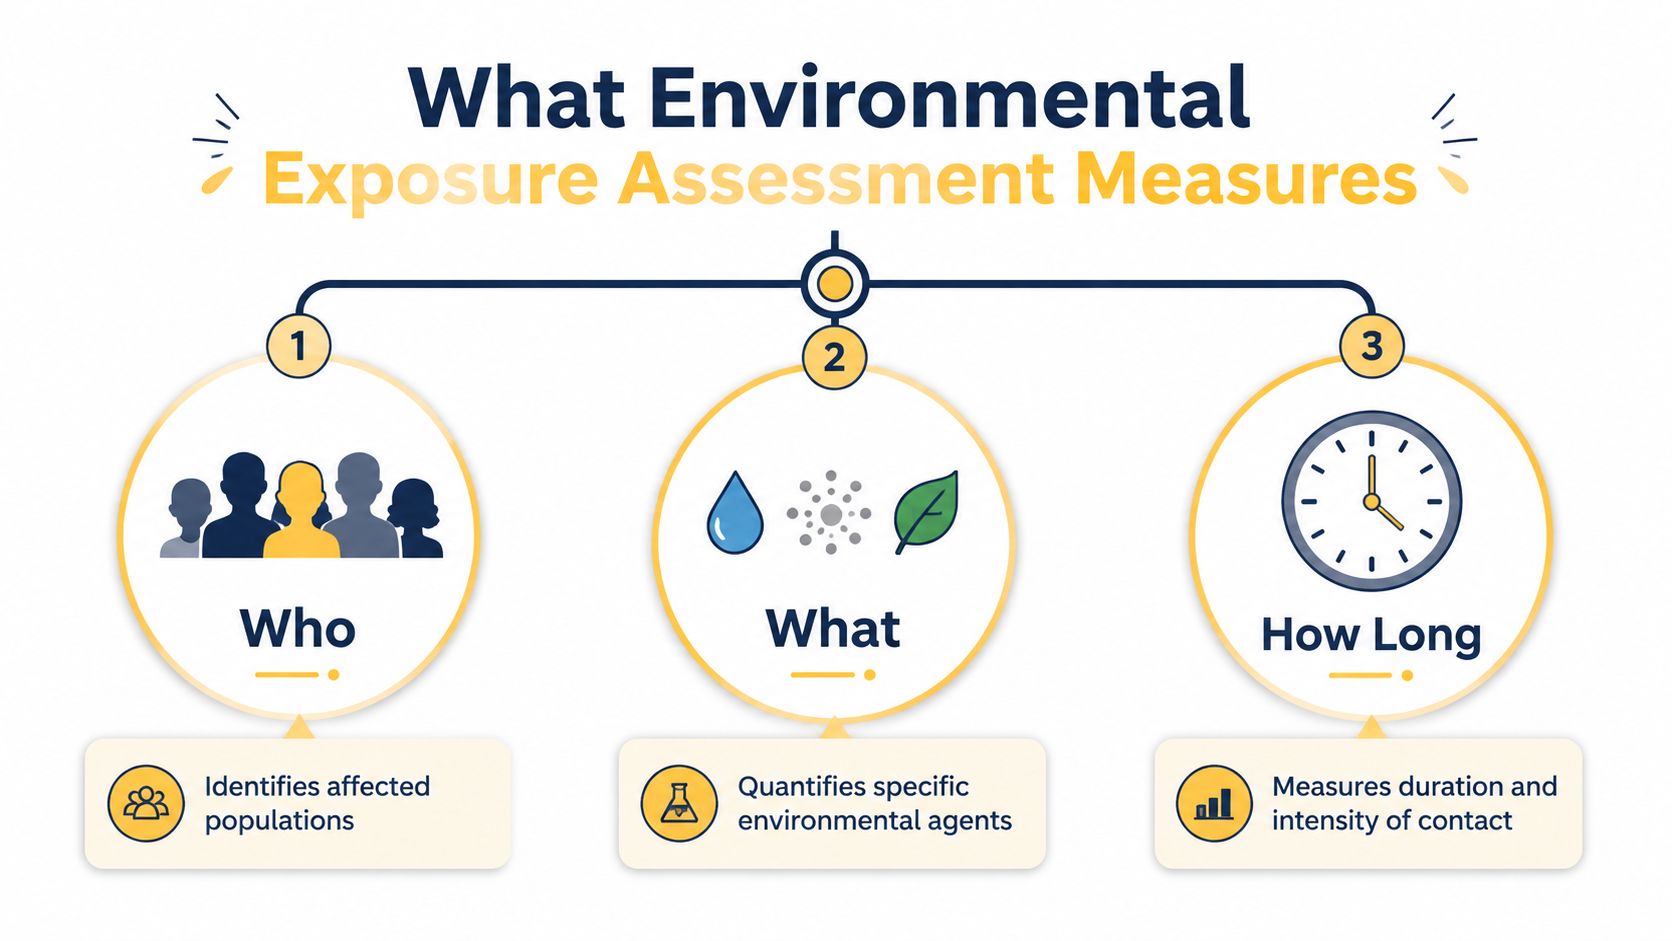
The four building blocks
Who identifies the exposed person or population. Population studies may examine residents across a city. For personal migraine management, the relevant record is your own symptom pattern, since a citywide average may not match your day.
What names the agent or condition. It could be PM2.5, nitrogen dioxide, humidity, ozone, sunlight, pollen, or another environmental variable. Some measures describe pollutants; others describe weather or biological material.
How long records duration and timing. A short commute, a full workday beside traffic, and a night in a poorly ventilated room create different exposure histories, even when the same pollutant is present.
Where describes the microenvironment. Your bedroom, kitchen, office, car, public transport, and outdoor spaces can each have different conditions. An outdoor monitoring station may not represent indoor air, which can change with ventilation, heating, cooking, and air filtration.
Why your movements matter
Time-activity patterns connect broad public-health methods with personal tracking. A population model may estimate exposure from your residential location, while your actual day includes several places with different pollutant levels and weather.
Apps and tracking tools can help combine those estimates with your diary. Record when you woke, where you spent extended periods, when symptoms began, and when the attack became disabling. Add available environmental readings. “Poor air quality” then becomes a timeline you can compare with your prodrome, the early phase that may precede headache pain. Use the pattern as evidence to review, not as proof that one condition caused an attack.
Which Environmental Factors Research Links to Migraines
Research doesn't support treating every environmental variable as an equally reliable migraine trigger. A 2024 systematic review found detrimental relationships across included studies in 78.3% of nitrogen dioxide findings, 68.0% of carbon monoxide findings, 76.0% of PM10 findings, and 61.3% of PM2.5 findings (systematic review indexed by PubMed). The same review reported no conclusive overall correlations for ozone and sulfur dioxide.
Weather may matter in a more time-sensitive way. A prospective study involving 98 people with migraine collected 4,406 diary days and found that higher relative humidity and higher ozone were associated with higher odds of migraine onset. The humidity association appeared stronger in the warm season, while the ozone association appeared stronger in the cold season (prospective migraine diary study).
A 2026 population-based study reported an association between short-term nitrogen dioxide exposure and emergency migraine-related encounters, with an odds ratio of 1.41 and a 95% confidence interval of 1.13–1.77. Solar radiation also showed an increased risk, with an odds ratio of 1.23 and a 95% confidence interval of 1.07–1.42. The study also linked cumulative exposures with markers of sustained migraine activity, distinguishing immediate exposure from longer-term burden (population-based migraine study).
| Environmental factor | Evidence strength | Key finding |
|---|---|---|
| Nitrogen dioxide | Relatively consistent in the included review | Detrimental relationships appeared in 78.3% of included findings, and short-term exposure was associated with emergency migraine-related encounters in a 2026 population-based study. |
| PM10 | Relatively consistent in the included review | Detrimental relationships appeared in 76.0% of included findings. |
| Carbon monoxide | Relatively consistent in the included review | Detrimental relationships appeared in 68.0% of included findings. |
| PM2.5 | Mixed but important | Detrimental relationships appeared in 61.3% of included findings. Long-term exposure was associated with migraine prevalence and severity across multiple studies, while short-term findings were inconsistent (narrative review). |
| Humidity | Seasonally relevant | Higher relative humidity was associated with higher odds of migraine onset in a prospective diary study, with a stronger warm-season association. |
| Ozone | Inconsistent overall, potentially time-sensitive | A prospective study found an association with migraine onset, particularly in the cold season, but a systematic review found no conclusive overall correlation. |
| Solar radiation | Relevant in recent population data | Solar radiation was associated with increased risk in the 2026 population-based study. |
| Temperature and weather changes | Possible association | A narrative review linked elevated ambient temperature and weather changes with headache outcomes. |
| Sulfur dioxide and noise | Limited or inconclusive for migraine in the cited reviews | The systematic review found no conclusive overall correlation for sulfur dioxide, while the narrative review found no association between noise pollution and headache endpoints. |
Short-term exposure asks whether conditions around an attack may have acted as a proximal trigger. Long-term exposure burden asks whether living with repeated exposure may relate to broader migraine frequency or severity. Those questions overlap, but they aren't interchangeable.
How Exposures Are Measured and Modeled Today
Environmental monitoring used to rely heavily on fixed-site stations. A monitor can provide valuable information about outdoor air at its location, but a station several miles away may not represent the air beside a busy road, inside your home, or along your commute.
WHO's global ambient air-pollution work illustrates the move toward population-weighted modeled estimates. Its assessments combine satellite sensing with ground measurements and report annual mean PM2.5 estimates globally, by region, and for more than 3,000 cities. The database also compiles annual mean PM10, PM2.5, and NO2 concentrations as city or town averages rather than readings from one station (WHO global ambient air-pollution assessment).
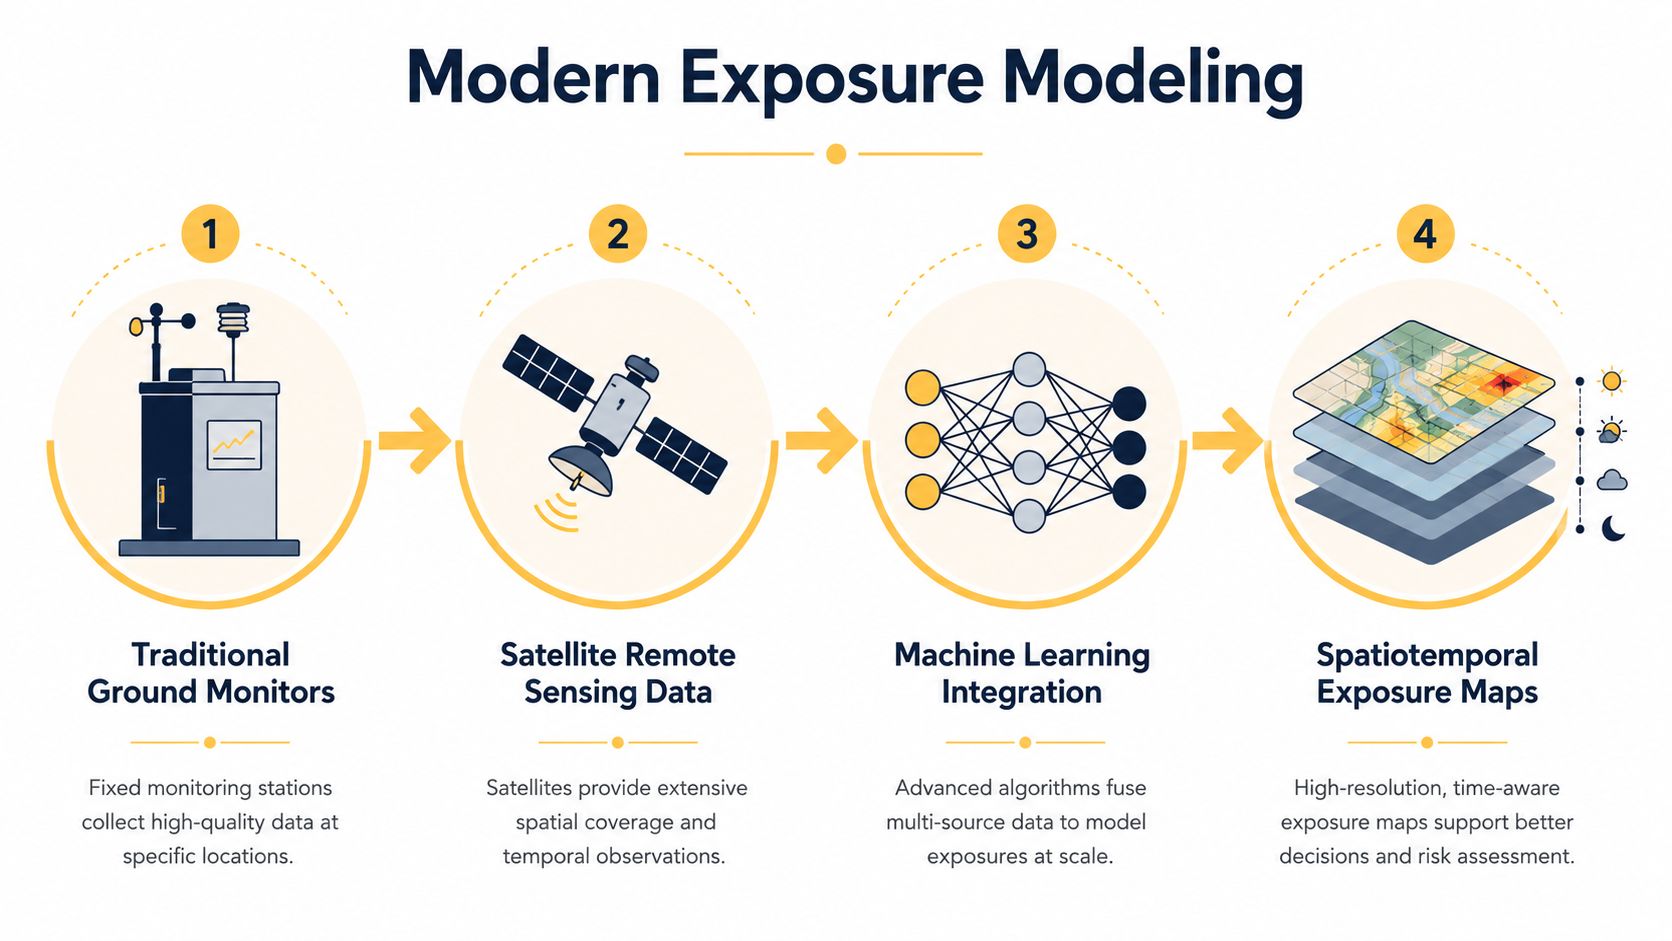
The main approaches compared
Proximity models estimate exposure based on distance to a source, such as a major road. They're simple and useful for identifying broad patterns, but distance alone can't describe wind, traffic variation, building design, or indoor infiltration.
Dispersion models simulate how emissions move through the environment. They can account for physical conditions more directly, although they require detailed source and weather inputs.
Hybrid models combine monitoring, satellite observations, geographic information, and statistical methods. They can fill gaps between monitors and estimate conditions across a wider area.
Inhalation models go one step further by incorporating breathing rate, activity, and time spent in different environments. A person exercising outdoors and a person resting indoors may inhale different amounts even under similar ambient concentrations.
Biomarker approaches measure chemicals or their metabolites in biological samples. These can reflect internal exposure, but they don't always identify the exact source, timing, or route of contact.
A review in Environmental Science Processes and Impacts notes that personal exposure is still rarely measured continuously because doing so is difficult. Model quality depends on residence-based siting, broad temporal coverage, pollutant-specific infiltration information, and accurate time-activity patterns.
Your weather or air-quality app therefore provides an estimate, not a perfect personal sensor. Treat it as a useful environmental signal that becomes more meaningful when paired with your location, movements, symptoms, and attack timing.
Turning Exposure Data Into Personal Migraine Insights
Population-level exposure data becomes personally useful when you place it beside your own health timeline. An app or spreadsheet can combine weather, air quality, and pollen readings with attack start times, symptoms, medication use, sleep, and daily activities.
The goal isn't to find one universal trigger. It's to identify whether a particular exposure repeatedly appears before your attacks, and whether the timing makes sense.
Look for exposure hit rates
An exposure hit rate asks how often a high-exposure condition occurs on your migraine days compared with your migraine-free days. For example, you might compare days with higher nitrogen dioxide or PM2.5 readings against days when you had no headache. This doesn't establish causation, but it can show which variables deserve closer attention.
Hourly forecasts can be more practical than a broad daily alert. “High pollen today” doesn't tell you whether your risk is more relevant during your morning commute, an afternoon outdoors, or the evening at home. An hour-by-hour view can help you plan rest, hydration, outdoor activity, or other strategies you've already discussed with your healthcare provider.
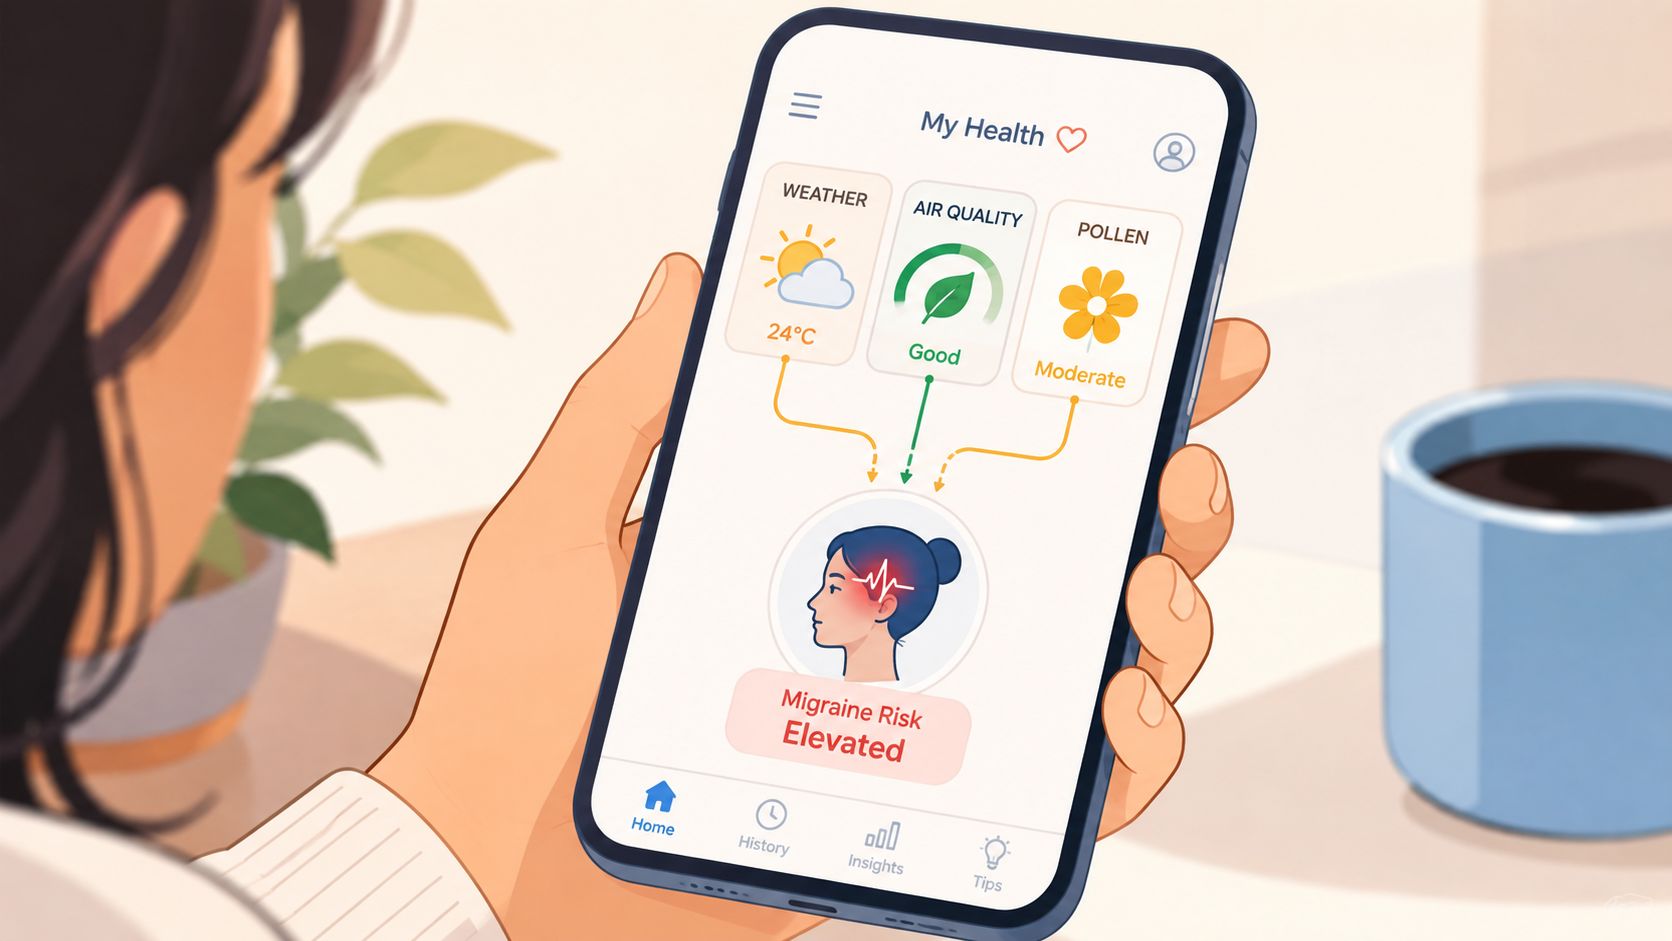
Consistency matters more than perfect logging
A single attack after a humid day can be coincidence. Repeated entries give you a stronger basis for questions, especially when you record the same details each time.
Log the beginning of symptoms, not just the time pain became severe. Include aura, if you experience it, nausea, photophobia, sound sensitivity, medication use, and the time you could resume normal activity. A tool such as Relief's approach to migraine tracking can help organize environmental signals alongside personal records, but no app can replace clinical evaluation or prove that an exposure caused an attack.
Practical rule: use forecasts to plan and logs to learn. Don't let either one decide what your symptoms mean without context.
What Current Exposure Assessment Cannot Yet Tell You
A migraine app may flag conditions that resemble those before earlier attacks, yet the result still has gaps. Chemical use changes faster than monitoring systems and biomonitoring programs can follow. Many substances therefore remain poorly characterized. A 2023 review describes regulatory difficulties linked to the growing number of chemicals on the market, outdated assessments, confidentiality claims, missing analytical standards, and limited biomonitoring capacity (review of chemical exposure assessment gaps).
Daily life adds another layer: mixtures. During one day, you may encounter several pollutants, weather conditions, indoor sources, and products. Research still examines cumulative exposure, mixtures, and effects across chemical classes less often than single-agent exposures, even though combined exposures better resemble ordinary life.
Why a forecast isn't a diagnosis
A forecast estimates that current conditions resemble those present before past attacks. It cannot establish that an exposure caused your migraine, identify an unmeasured factor, or show whether your body had already entered the prodrome phase. A forecast is closer to a weather map than a medical test. It describes conditions around you, not the biological cause of symptoms.
A policy and research discussion on exposure science identifies ongoing needs for better integration, new monitoring methods, and stronger data infrastructure. Those gaps matter for migraine management. Static readings do not automatically become reliable personal predictions when your conditions and routines change.
Evidence also differs by environmental factor. Nitrogen dioxide and several particulate measures show more consistent signals in the cited reviews than ozone, sulfur dioxide, or noise. Your pattern may differ from the population pattern, so use exposure data to form informed questions rather than impose new rules on yourself.
Before choosing a tracking service, read Relief's privacy information to understand how it handles personal data.
Practical Steps to Start Tracking Your Environmental Triggers
You can begin without buying a personal air monitor or changing your entire routine. Start with a small set of variables and record them consistently enough to compare migraine days with migraine-free days.
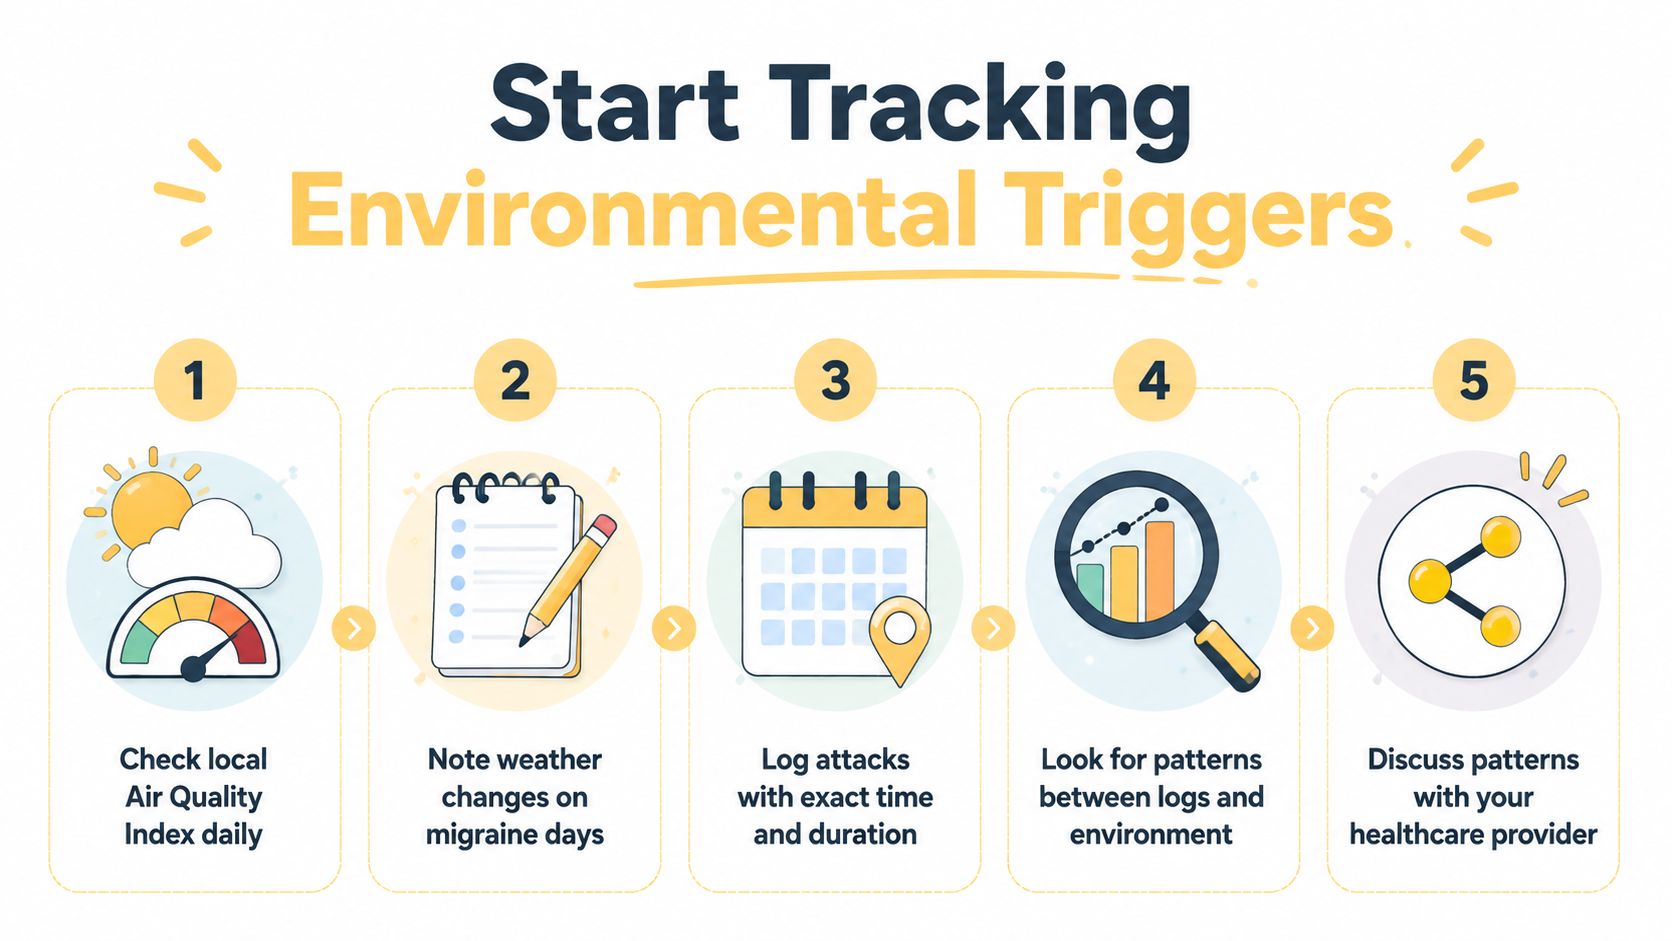
Build a usable daily record
Check local air quality. Note the Air Quality Index and, when available, pollutant-specific readings. Give particular attention to nitrogen dioxide, PM2.5, and other measures highlighted in migraine research.
Record weather conditions. Log humidity, temperature, and noticeable weather changes. Barometric pressure changes are also reasonable to track as a personal variable, although the evidence and individual response can vary.
Time the attack precisely. Record when prodrome symptoms began, when headache pain started, how long the attack lasted, and which symptoms appeared. “Bad all day” is harder to compare than a clear timeline.
Add context without blaming yourself. Include sleep quality, meals, stress, menstrual-cycle information if relevant to you, activity, time outdoors, and indoor locations. These details help separate environmental exposure from factors that happened at the same time.
Review patterns over time. Look for repeated relationships rather than reacting to one unusual day. A pattern is more useful when the same exposure appears before several attacks and less often before symptom-free days.
Your records can support a conversation with a healthcare provider, especially if your attacks are changing or becoming more frequent. Share the timing, symptoms, environmental observations, and any treatments you've used rather than presenting the log as a self-diagnosis.
This article is for informational purposes and is not medical advice. Consult a healthcare provider for personalized guidance. Seek immediate medical care for a sudden severe headache, a headache with fever or stiff neck, new neurological changes, or a headache after a head injury.
A tracking tool such as Relief can place environmental readings beside your symptom logs, helping you review possible patterns without treating any single exposure as a confirmed cause.
Relief combines your migraine logs with local weather, air quality, pollen, pressure, heat, UV, and other environmental signals to provide an hour-by-hour risk forecast. Visit Relief to start tracking the conditions that may matter in your own history and plan your days with more information.


