
You checked the forecast, saw a low-risk day, and still got blindsided by a migraine. That kind of miss is maddening, especially when you're already trying to plan work, family time, or just a normal afternoon. The fastest way to improve forecast accuracy for migraine risk is to log your attacks consistently, clean up the history your app learns from, and keep a tight feedback loop between what the model predicts and what happens.
This article is for informational purposes and is not medical advice. Consult a healthcare provider for personalized guidance.
Table of Contents
- Why Your Migraine Forecast Keeps Getting It Wrong
- Log Migraines the Same Way Every Time
- Bring in the Environmental and Wearable Signals That Actually Matter
- Keep the terms precise
Why Your Migraine Forecast Keeps Getting It Wrong
A migraine forecast can look confident and still miss the day that matters. That's because migraine prediction is a sparse, personal forecasting problem, not a tidy sales pipeline or supply-chain dataset with steady volume and clean labels. If the app only sees scattered entries, missing weather context, and no correction when the forecast was wrong, it has almost nothing reliable to learn from.
The other issue is expectation. A personal forecast should reduce surprises, not eliminate migraines. The point is to make the pattern legible enough that you can plan around risk earlier, rather than treating every low-risk number like a promise.
Practical rule: a forecast gets better when the app can compare forecast vs. actual repeatedly at the same level of detail, not when you stare at one isolated risk score.
That's the same reason broad forecasting guidance emphasizes baseline comparison, bias detection, and regular review. Without a stable comparison point, you can't tell whether the model is improving or just getting lucky on quieter weeks. In migraine, that baseline lives in your own history, which is why a tool like Relief has to learn from your logs, local conditions, and repeated check-ins.
Three things usually break personal forecasts. First, logging is inconsistent, so the history is noisy. Second, environmental signals are missing or delayed, so the model can't connect pressure changes, heat, or pollen to your attacks. Third, there's no feedback loop, so the same errors keep repeating.
Log Migraines the Same Way Every Time
The biggest lever is boring, but it works. Consistent logging gives the model comparable entries, and comparable entries are what let it learn patterns instead of guessing. Log your migraine as close to the start as you can, because memory gets fuzzy fast, especially when you're in pain or light-sensitive.
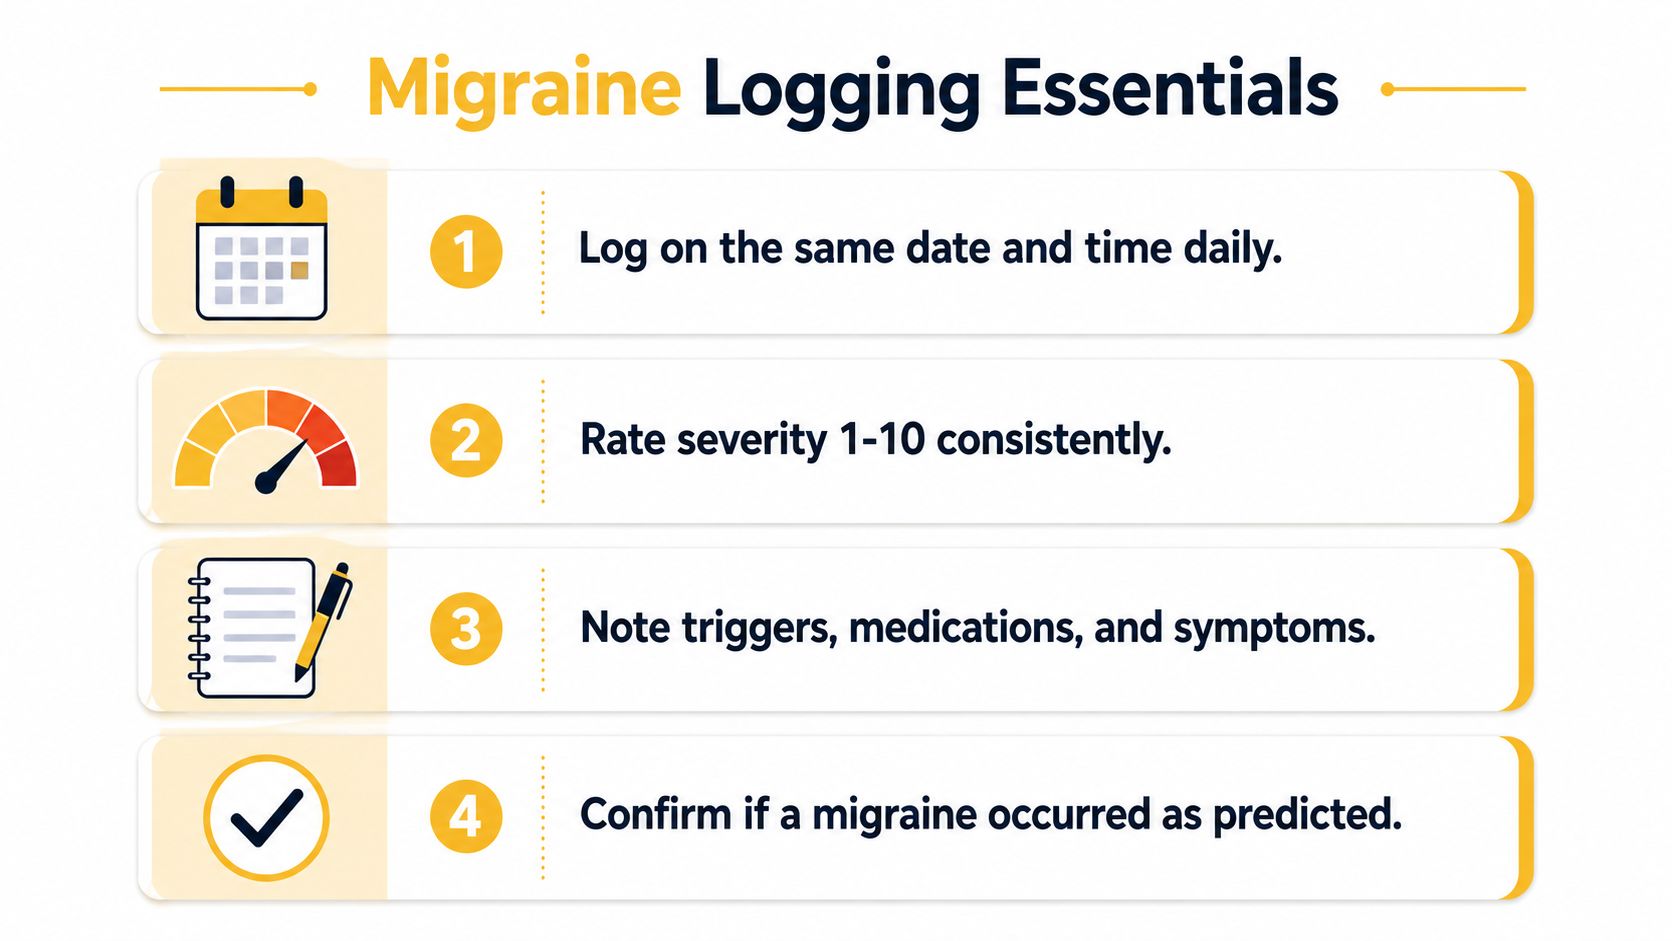
A clean entry usually includes the same handful of fields every time. Use one template and stick to it for at least several weeks before judging whether the forecast is helping.
- Start time: Record when the attack began, not when you finally sat down to log it.
- Severity: Use one pain scale consistently, so your data doesn't drift from day to day.
- Symptoms: Note migraine-specific features like photophobia, which means light sensitivity, aura, which is a neurological symptom that can happen before or during an attack, and postdrome, the drained or foggy phase after the attack.
- Possible triggers and medication taken: Capture what stands out while it's fresh, including skipped sleep, stress, weather shifts, or any treatment you used.
- Outcome on non-migraine days: Log the quiet days too. Absence data matters when attacks are infrequent.
A vague entry, like “bad headache, took something, maybe stress,” doesn't teach the model much. A structured one gives the forecast a shape it can compare against later. That's the same reason forecasting practice recommends comparing against actual results every cycle and using the same aggregation level each time.
Log within minutes if you can. The detail that matters most, like aura timing or whether nausea came first, is usually the first thing to blur.
Here's the embedded walkthrough for the logging flow.
Bring in the Environmental and Wearable Signals That Actually Matter
Not every input deserves a place in your migraine forecast. The useful signals are the ones that change often enough, and clearly enough, to help explain why one day felt safe and another didn't. In practice, that usually means a small set of environmental and wearable inputs, not a kitchen sink of optional fields.
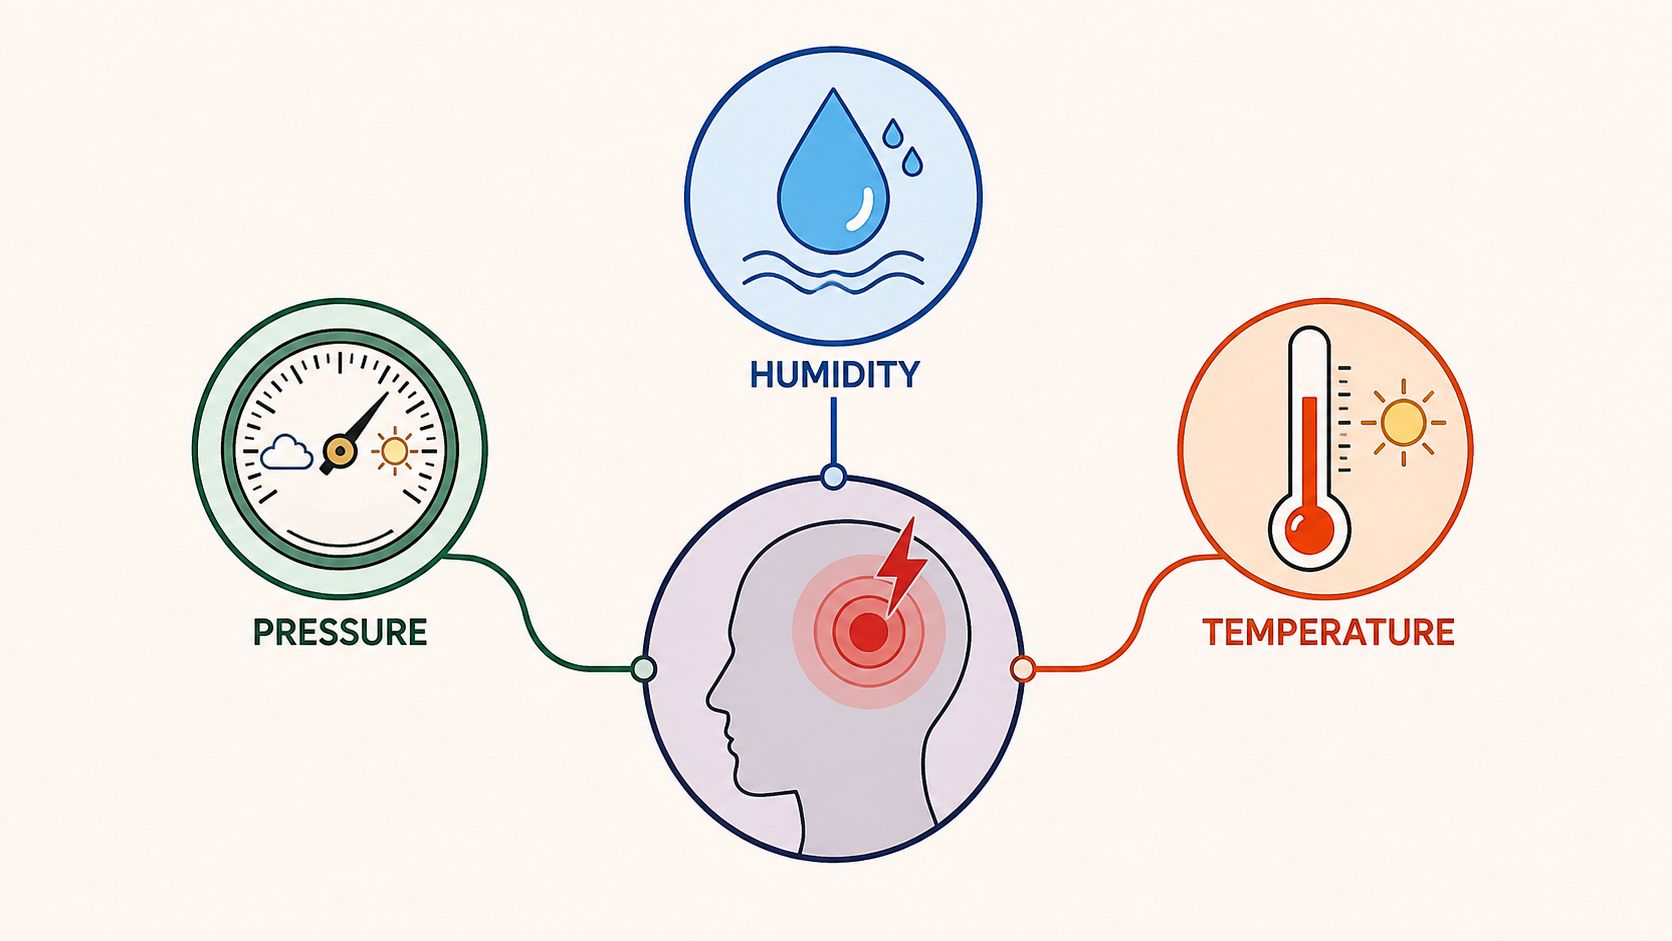
Barometric pressure changes, humidity shifts, temperature swings, air quality, and pollen are often the most practical weather signals to track because they move with real-world exposure. On the wearable side, sleep duration and heart rate variability can be useful where your device records them reliably. Menstrual cycle tracking also matters for some people, but only if it's relevant to your pattern.
Practical rule: fewer high-signal inputs usually beat a cluttered dashboard. If a field never changes your understanding, it's probably noise.
Data permissioning matters too. On iPhone, HealthKit access is often what allows sleep and other health signals to sync into the forecast, and location access is usually needed for local weather and air-quality context. If those permissions are turned off, the app may still show a number, but that number has less information behind it.
The trade-off is clear. More data can improve the forecast only if it's timely, clean, and relevant. Delayed feeds, duplicate sources, and missing permissions all make the model less certain, not more informed.
For migraine users, the goal isn't surveillance. It's context. The forecast should know whether a storm front, a poor sleep night, or a pollen spike lines up with the way your attacks behave.
Clean and Annotate Your History Before Trusting the Numbers
Old logs are rarely as clean as they look. Over time, you collect edge cases, weird travel days, medication changes, and attacks that might not have been migraine at all. If you don't annotate that history, the forecast may learn the wrong lesson from the right data.
Start with the obvious outliers. A one-off stress attack during travel should be flagged, not mixed into your usual weekday pattern. A hangover-style headache that got logged as migraine should be corrected if you later realize the symptoms didn't fit. A possible medication-overuse pattern should also be marked, because it changes the meaning of the surrounding days.
Keep the terms precise
Prodrome is the early warning phase before a migraine, when some people notice mood changes, food cravings, or neck stiffness. Aura is a neurological symptom that can include visual changes or other sensory effects. Postdrome is the recovery phase after the attack, when you may feel drained or mentally slow.
Those distinctions matter because they keep your annotations consistent. A migraine day and a severe tension-type headache are not interchangeable in a forecast, even if both hurt. If the labels stay sloppy, the model will blur together very different patterns.
Cleaned history is more useful than raw history because the forecast learns from the pattern you actually want, not from every accidental label in the archive.
A monthly review is enough for many people. Open the last few weeks, flag anything unusual, and correct only what you know. Don't backfill guesses just to make the timeline look complete, because guessed data usually adds more confusion than signal.
The best habit is short and repeatable. Spend a few minutes once a month checking whether each entry still looks right, whether the migraine was migraine, and whether any special circumstances need a note. That's enough to keep your history useful without turning tracking into a second job.
Track the Right Accuracy Metrics for a Personal Forecast
Most migraine apps show a risk percentage, but a single number doesn't tell you whether the forecast is getting more useful. You need a few plain-language checks: how often a high-risk day produced a migraine, how many false alarms you got, and how often the app missed an attack on a low-risk day.
A rolling review is better than judging one bad week. Migraine is irregular, so tiny samples can make the forecast look brilliant or useless for no good reason. Looking across a longer window helps you see whether the model is learning or just swinging with random variation.
The broader forecasting literature makes the same point. A simulation study across more than 32,000 time series found that 80% of forecast accuracy improvements had no economic impact as summarized in the forecasting guide, which is a good reminder that better-looking numbers aren't always better decisions. For migraine, the goal is fewer surprises and better planning, not a prettier dashboard.
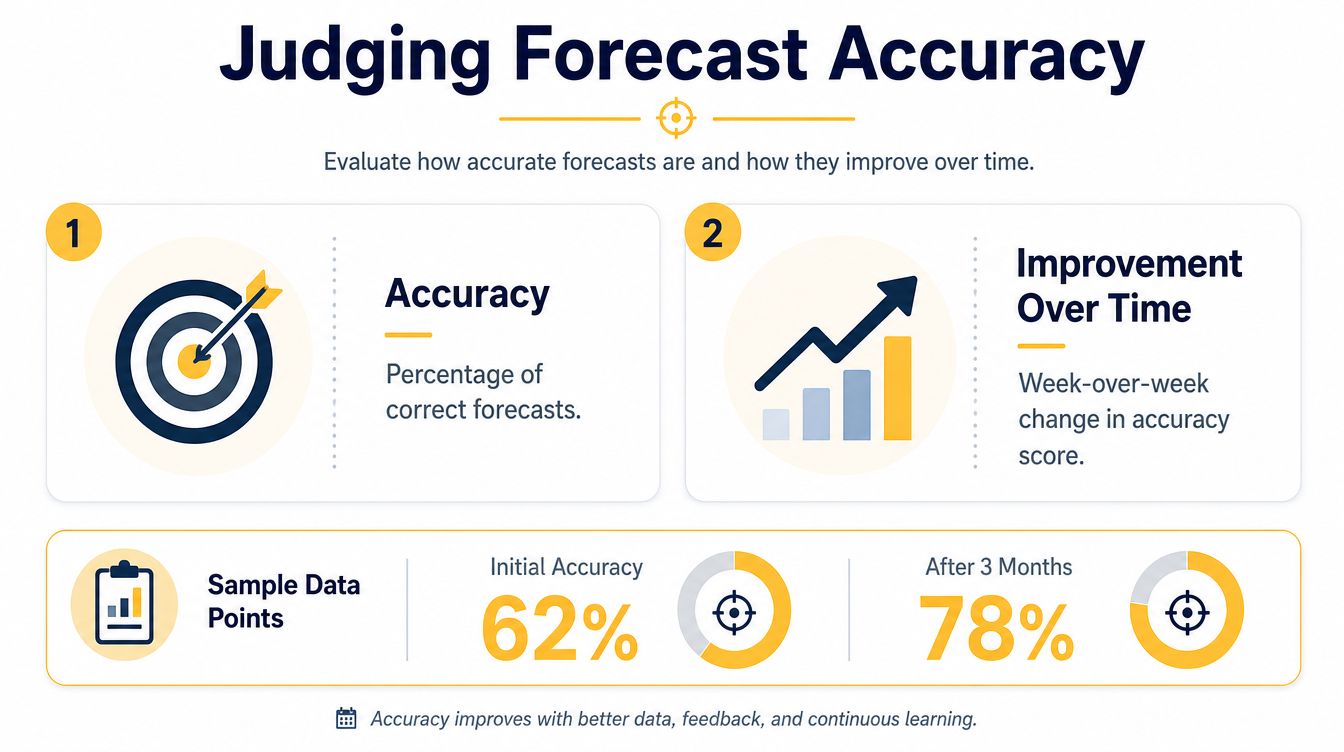
If you want a simple personal scorecard, use this logic:
- Hit rate: a high-risk forecast followed by a migraine day.
- False alarm: a high-risk forecast that passed without an attack.
- Missed event: a migraine that showed up on a low-risk day.
- Rolling review: compare the latest month against actual outcomes, not just your memory of a bad Thursday.
These numbers help you ask a better question. Instead of “Is the app right?”, ask whether the app is getting better at warning you early enough to change plans. That's the metric that matters in real life.
The trap is chasing a higher accuracy score at all costs. If the model becomes so cautious that every day looks risky, it may feel safer without becoming more useful. In migraine forecasting, useful usually means calibrated, not dramatic.
Close the Loop With Corrections and Confirmations
A forecast that never gets corrected will drift. That's true whether you're watching inventory, revenue, or your own migraine risk. The moment you confirm what happened, the model gets one step closer to your real pattern instead of the pattern it guessed at last month.
A simple weekly ritual is enough. Check the past seven days, compare the app's risk with the days you had attacks, and mark any clear misses. If a day felt off before the attack, note what was happening around it, like poor sleep, weather shifts, or a change in routine.
When the forecast is wrong, correct it. When it's right, confirm it. When severity changed after the fact, update that too, because a more accurate severity record helps the model learn which days were mild, which were debilitating, and which symptoms tended to cluster together.
The evidence from forecast research supports combining inputs instead of betting on one judgment. A Wharton review found that combined forecasts reduced error by about 12%, and Delphi improved accuracy in 19 of 24 comparisons via the Wharton evidence-based forecasting review. In personal migraine tracking, that same idea shows up when the app's prediction, your own felt sense, and a partner's observation all point in the same direction.
Internal review matters too. Relief's own approach to forecasting and tracking is built around the same loop, as outlined in its about page. If your forecast and your lived experience keep disagreeing, that disagreement is useful data, not a failure.
A five-minute review each week is enough to keep the loop alive. The point isn't perfect memory, it's repeated correction.
Privacy, Data Quality, and a Realistic First Week
The first week should be simple. Log every day, including migraine-free ones. Turn on weather and air-quality feeds, allow HealthKit access for sleep and heart data if you use them, and do one weekly forecast-versus-actual review. Keep the data inside a privacy-respecting app so you're not trading clarity for exposure. You can review Relief's privacy approach before deciding how much you want to share.
If you want a realistic starting checklist, use this:
- Day 1: Set up logging and record one baseline entry.
- Day 2 to 7: Log every day, even if nothing hurts.
- During the week: Let local weather and air-quality data sync.
- End of week: Compare forecasted risk with actual migraine days.
- Any time: Mark red-flag symptoms as medical concerns, not tracking data.
Red flags should never become part of a self-optimization experiment. Sudden severe headache, headache with fever or stiff neck, neurological changes, or headache after a head injury need immediate medical care.
That's the line between self-tracking and safety. Forecasting can help you notice patterns earlier, but it can't replace a clinician when something looks different, severe, or urgent.
The most useful migraine forecast is the one that learns what's specific to you, over time. Relief is built around that idea, so your logs, symptoms, and local conditions can sharpen the model instead of getting lost in generic noise.
If you want a cleaner read on your own migraine pattern, start logging consistently this week and let the forecast learn from real outcomes instead of guesswork. You can try Relief to track symptoms, weather, and daily risk in one place, then use the patterns you see to plan your day with fewer surprises.


