You wake up with pressure behind your eyes, a scratchy throat, or the uneasy feeling that a migraine may be building. Before you decide whether to go outside, check the pollen forecast today, but don't treat one color or number as a complete answer. A pollen forecast estimates airborne pollen exposure for your location, and it becomes more useful when you read it alongside weather, air quality, and your own symptom history.
Pollen may be one factor in a difficult day, but migraine isn't the same as an allergy headache or ordinary sinus pressure. The aim is to spot patterns early, reduce avoidable exposure, and know when a forecast is too broad to guide a personal decision.
Table of Contents
Why You Check the Pollen Forecast Every Morning
Checking your eyes, sinuses, energy, and head pressure before you start the day can become a quiet survival routine. If you've lived with migraine, you may already know that early signs matter. Prodrome, the phase before the main pain, can include fatigue, mood changes, food cravings, neck stiffness, or difficulty concentrating. Nasal congestion and irritated eyes can appear alongside allergies, migraine, or both.
A pollen forecast today is a short-range prediction of airborne pollen concentration. Pollen count is expressed as the number of pollen grains in a cubic meter of air, as defined in the CAMS explanation of ground-level pollen forecasts. Public systems commonly turn that estimate into labels such as low, moderate, high, or very high for a city, region, or ZIP code.
What the forecast measures
Monitoring stations collect airborne particles with equipment such as rotorod samplers or Burkard traps. Analysts identify and count pollen by type, then forecasting systems use those observations with weather projections, vegetation information, and seasonal patterns.
That means the number on your screen usually isn't a live measurement outside your front door. It's a model output that may combine recent observations with expected wind, temperature, rainfall, and the stage of the local pollen season.
Operational forecasting has become more practical because public services now provide daily and sometimes hourly allergen-risk estimates. A 2024 review of pollen forecasting describes process-based systems including SILAM, COSMO-ART, and the CAMS ensemble, often with hourly resolution, while U.S. weather services can provide city-level forecasts several days ahead.
Practical rule: Use the forecast to plan exposure, not to declare whether you're guaranteed to have symptoms.
The index also has blind spots. It may not identify the species that triggers your symptoms, and a station several miles away may not reflect pollen near your home, workplace, school, or running route.
What the Pollen Index Numbers Actually Mean
Most public forecasts use four broad categories. Those labels help you scan quickly, but they don't represent one universal scale. The numeric boundaries change according to the pollen type, so comparing a grass reading directly with a tree or weed reading can mislead you.
One commonly used standard reports weeds and trees as low at 1 to 9 grains per cubic meter, moderate at 10 to 49, high at 50 to 499, and very high at 500 or more. For grasses, the bands are lower: low at 1 to 4, moderate at 5 to 19, high at 20 to 199, and very high at 200 or more, according to the peer-reviewed pollen-count standard indexed by PubMed.
Pollen index levels and typical symptom range
| Index Level | Grains per m³, approximate | Typical Symptoms |
|---|---|---|
| Low | Trees and weeds: 1–9. Grass: 1–4 | Sensitive people may notice mild irritation, congestion, or no symptoms |
| Moderate | Trees and weeds: 10–49. Grass: 5–19 | Congestion, sneezing, itchy eyes, or increased sensitivity may appear |
| High | Trees and weeds: 50–499. Grass: 20–199 | More noticeable allergy symptoms and a greater need for exposure planning |
| Very high | Trees and weeds: 500+. Grass: 200+ | Substantial exposure for sensitive people, especially outdoors or near active sources |
These ranges aren't a personal threshold. Two people can respond differently to the same reading, and a person may react strongly to one species while barely noticing another. A forecast labeled high can therefore be useful as a warning, but it can't predict the intensity of your migraine or diagnose an allergy.
Some systems also use species-specific thresholds. For example, a major reporting approach places the start of the season for birch and olive at 10 pollen grains per cubic meter, with peak levels at 100, while grass and ragweed use 3 for season start and 50 for peak period, as outlined by the Asthma Center's pollen-count guidance.
The practical problem is comparison. A weather app's “high” rating, a certified station's count, and an allergy app's risk score may use different inputs and boundaries. A single regional label can also hide a high tree reading in one neighborhood or a localized grass spike near open fields.
Tree Grass Weed and Mold Pollen by Type
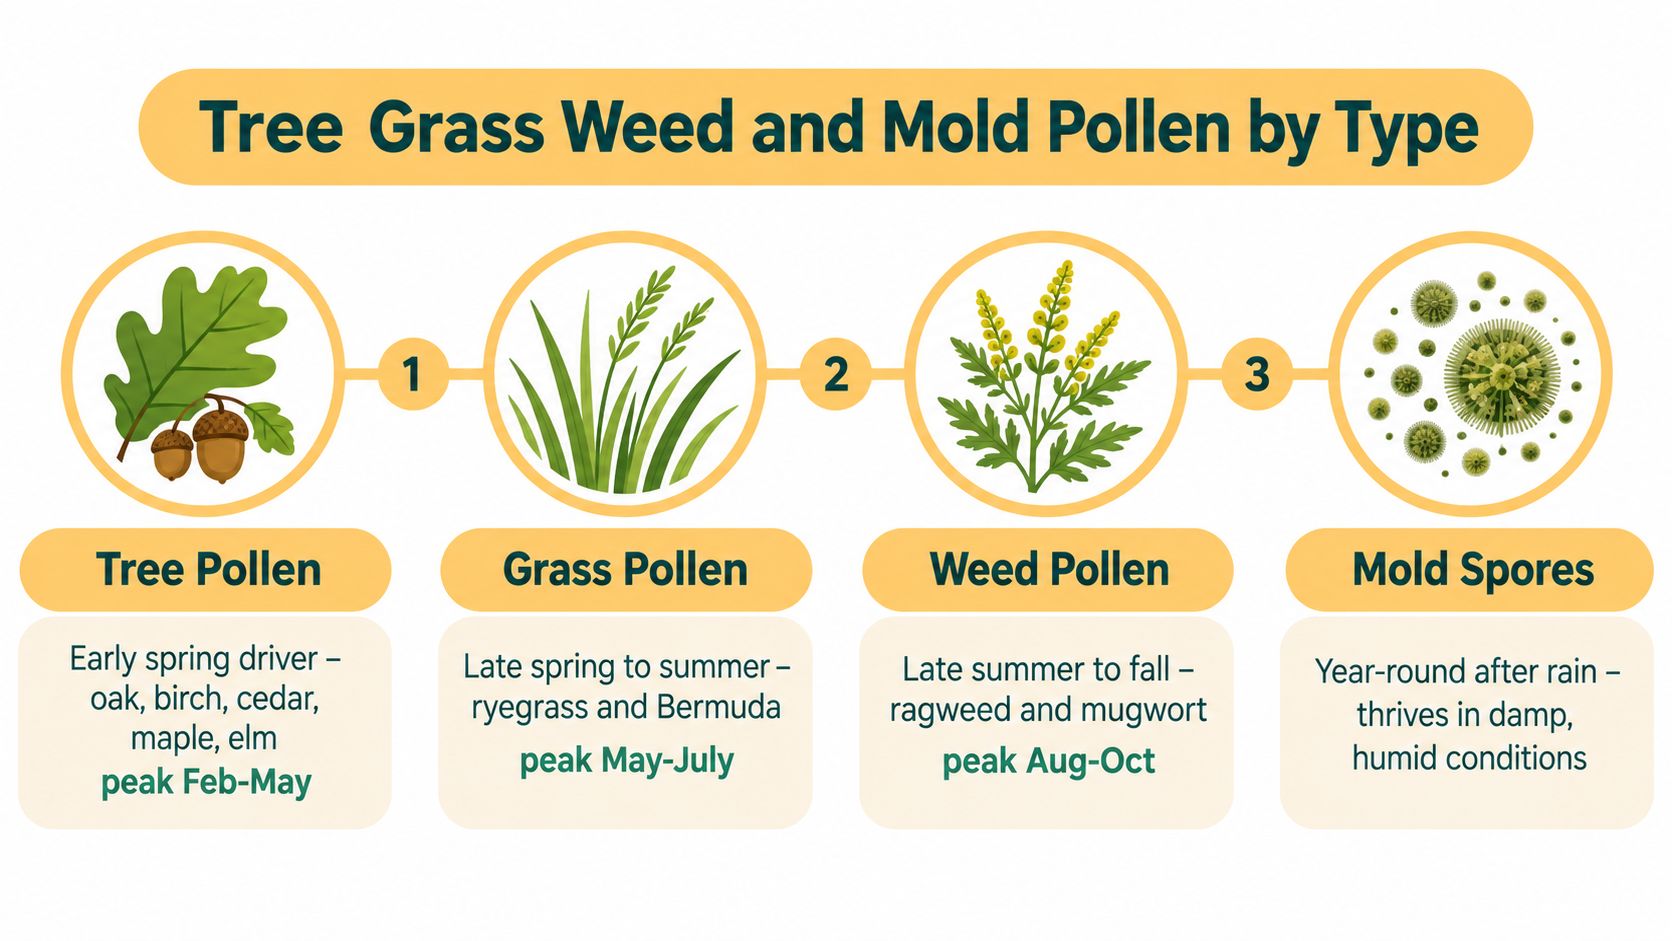
A useful forecast starts with the allergen category, not the overall color. Tree, grass, weed, and mold behave differently, appear at different times, and may affect you differently.
Tree pollen often drives the earlier part of the season. Oak, birch, cedar, maple, and elm are common examples. In many regions, tree pollen becomes important from late winter into spring, although local weather and vegetation change the timing.
Grass pollen tends to become more prominent later in spring and through summer. Timothy, Bermuda, and Johnson grass are examples that may appear in regional reports. Grass can be easy to overlook when an app displays only one combined number, especially if tree pollen is declining while grass pollen rises.
Weed pollen is often associated with late summer and fall. Ragweed is a major example, with sagebrush, pigweed, and lamb's quarters also appearing in some areas. If your symptoms return after tree season ends, the dominant allergen may have changed rather than disappeared.
Mold spores aren't true pollen, but forecasts may group them into allergy information because they can contribute to respiratory symptoms. Mold commonly thrives in damp, humid conditions and around leaf litter. Rain can temporarily reduce airborne pollen, while the moisture that follows may support mold growth.
Why the category matters for migraine tracking
If you log only “pollen high,” you lose the detail that may explain a pattern. Record the dominant category, or the specific species when the service provides it. You might find that head pain follows a combination of birch exposure and poor sleep, or that grass pollen matters only when wind and outdoor exercise occur together.
Forecasts remain imperfect. Reporting on current forecasting limitations describes accuracy ranging from 7% to 53% in some settings, and a 2025 analysis found that the predicted top three daily tree pollen species matched actual data only 20% of the time, as discussed in coverage of pollen forecast accuracy problems. Treat species labels as useful clues, not unquestionable facts.
The video below offers another visual explanation of pollen types and seasonal exposure.
Trusted Sources and Apps for Today's Forecast
No single pollen service covers every place with the same precision. Public networks, weather providers, private vendors, and symptom apps may all present different versions of today's risk because they collect and model information differently.
When you compare a source, look at five practical features:
- Geographic detail: Does it cover your country, city, ZIP code, or a more local area?
- Pollen breakdown: Can you see trees, grasses, weeds, and mold separately?
- Update timing: Does the service refresh daily, or does it offer shorter hourly windows?
- Environmental context: Does it show wind, temperature, humidity, pressure, or air quality?
- Personal history: Can you compare the forecast with your logged symptoms over time?
Comparing trusted pollen forecast sources
| Source | Coverage | Update Frequency | Pollen Types | Best For |
|---|---|---|---|---|
| National Allergy Bureau | Selected U.S. monitoring locations | Often based on certified counts and reporting cycles | Type-specific where available | Broadly trusted local measurements |
| Met Office | UK regional forecasting | Short-range daily forecasts | Regional pollen categories | UK planning and regional awareness |
| Pollen.com | U.S. consumer coverage | Daily forecast availability varies by location | Common allergen categories | Quick seasonal checks |
| AccuWeather and Weather.com | Weather-linked locations | Forecast timing varies | Pollen information where available | Combining weather and pollen in one place |
| IQAir AirVisual | Air-quality-focused locations | Frequent air-quality updates | Pollen availability varies | Viewing pollution alongside environmental conditions |
| Migraine Buddy and Allergy Plus | App-based coverage | May include forecast and user updates | Varies by app and location | Symptom logging and daily planning |
Certified stations can give you a grounded local observation, but coverage may be limited and delayed. A modeled service can provide a more convenient city-level or hourly outlook, but its estimate may not match conditions beside a specific park or roadside.
For readers comparing migraine-focused tools, this guide to a migraine forecast app can help clarify how symptom history and environmental signals fit together.
Weather and Air Quality Shape Your Actual Exposure
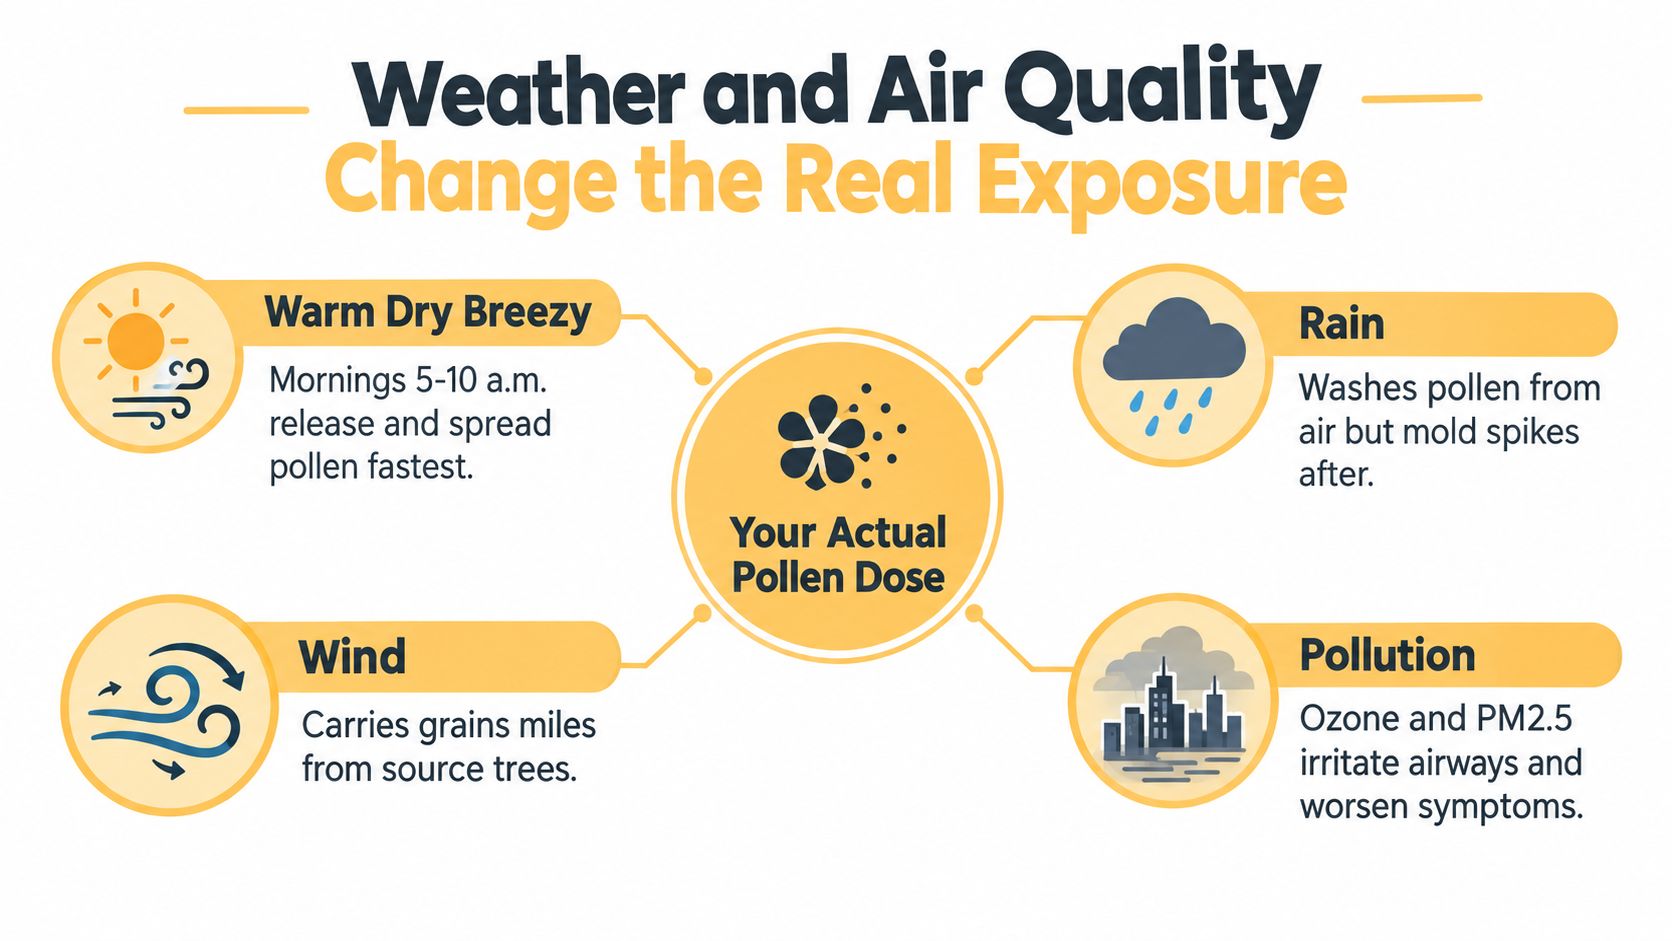
A regional pollen count is a useful reference, but it cannot describe every place you may visit. Your exposure changes with the route you take, the time you spend outdoors, wind direction, and other irritants in the air. For migraine planning, read the pollen forecast alongside weather and air-quality information.
Warm, dry, breezy conditions can release pollen and carry it beyond the plants that produced it. Rain may wash particles from the air for a while, then levels can rise as surfaces dry. Damp conditions can also support mold spores. A morning forecast may therefore describe a different situation from an afternoon walk.
The variables that change the day
- Wind: Air movement can carry pollen away from nearby plants and bring grains from more distant sources.
- Humidity: Moisture changes particle behavior and can support mold growth.
- Temperature: Warmth often encourages plant release, while abrupt changes may coincide with other weather conditions that some people associate with migraine.
- Barometric pressure: A falling pressure pattern may matter to people who identify weather changes as migraine triggers.
- Air pollution: Ozone, PM2.5, and nitrogen dioxide can irritate the airways and make a given pollen load feel more burdensome.
The review of pollen prediction limits and environmental inputs notes that standard ground monitoring can involve a 3- to 9-day lag. Missing weekend or holiday measurements may also smooth away short-lived spikes. The review describes combining weather, vegetation, and air-quality information instead of relying on pollen counts alone.
Public forecasts can miss species differences and conditions around a particular park, garden, or roadside. A moderate regional category may therefore require care on a windy route, while a high reading may overstate exposure on a sheltered path after rain.
Use this air-quality measurement guide to understand pollution readings, then compare them with the pollen forecast and your planned time outdoors.
Pollen Migraine and the Allergy Headache Overlap
Allergy symptoms and migraine symptoms can overlap, which makes mornings confusing. Nasal congestion, facial pressure, watery eyes, fatigue, and head pain don't automatically mean you have a sinus headache.
Migraine is a neurological condition that can involve moderate or severe pain, often with nausea, photophobia, which means sensitivity to light, or phonophobia, which means sensitivity to sound. Some people experience aura, temporary neurological symptoms such as visual changes or tingling, before or during an attack. A headache may be uncomfortable without meeting the pattern of migraine.
A practical comparison
| Feature | Allergy or sinus-related discomfort | Migraine pattern |
|---|---|---|
| Sensation | Pressure, fullness, or a dull ache around the face | Often throbbing or pulsing, though experiences vary |
| Other symptoms | Sneezing, itchy eyes, congestion, runny nose | Nausea, light or sound sensitivity, aura, or worsening with activity |
| Timing | May follow exposure and persist with allergy symptoms | May include prodrome, an attack phase, and postdrome, the recovery period |
| Interpretation | Suggests respiratory or sinus irritation | Suggests a migraine pattern, but only a clinician can assess your symptoms |
Research supports an association between allergy status and migraine frequency in some people. In a PubMed-indexed study, migraine attacks occurred more often among patients who tested positive for allergies than among those who tested negative within the migraine group, with p = 0.001, as reported in this clinical pollen and allergy overview. That finding doesn't prove that pollen causes every migraine, and it doesn't establish a universal mechanism.
Inflammation, sleep disruption, dehydration, bright light, pressure changes, and outdoor exposure can arrive together. Your useful question isn't “Was pollen high?” It's “What combination of conditions appeared before this attack?”
You can use this guide to whether pollen can trigger migraines to think through that relationship without treating correlation as certainty.
This article is for informational purposes and is not medical advice. Consult a healthcare provider for personalized guidance.
Using the Forecast to Lower Migraine and Allergy Risk
A forecast becomes actionable when it changes a decision you were already going to make. You don't need a perfect prediction. You need a repeatable way to compare exposure with what happens in your body.
A same-day routine
- Check before leaving home. Note the overall level, dominant pollen type, wind, temperature, pressure trend, and air quality.
- Plan the exposure. On a difficult day, consider indoor exercise, a shorter outdoor errand, or a route away from flowering vegetation.
- Recheck later. Conditions can change during the day, so compare the morning outlook with the later update rather than assuming the first reading covers every hour.
- Reduce what comes indoors. Shower and change clothes after outdoor time, keep windows closed when exposure is high, and use suitable indoor filtration if it helps your environment.
- Protect your eyes and airways. Sunglasses can reduce direct eye exposure, and a saline rinse may help some people clear nasal irritants.
- Follow your existing care plan. If a clinician has recommended allergy treatment, use it as directed. Don't start, stop, or change medication based only on an app label.
Logging matters because broad indexes can't account for your sleep, stress, hydration, meals, activity, or personal sensitivity. Record the pollen category, weather shift, air-quality reading, time outdoors, and the first symptom you noticed.
Symptom-to-action response guide
| Warning Sign | Pollen Reading | Immediate Action |
|---|---|---|
| Itchy eyes or repeated sneezing | Moderate or rising | Limit unnecessary outdoor exposure and note the likely pollen type |
| Congestion with wind or poor air quality | Any level, especially when conditions shift | Check air quality and wind, close windows, and use your established allergy plan |
| Early migraine signs, such as light sensitivity or neck stiffness | Any level | Reduce stimulation, hydrate if appropriate for you, review your personal plan, and log the conditions |
| Symptoms after yard work or a windy walk | High or very high | Change clothes, shower, reduce further exposure, and record the location and timing |
| New, unusually severe, or rapidly changing neurological symptoms | Any level | Seek medical assessment rather than attributing the symptoms to pollen |
Do not pre-medicate or change treatment unless that approach is already part of guidance from your healthcare provider. Pollen information can support planning, but it shouldn't replace medical care.
Quick Reference Checklist and Glossary
Keep this list available before outdoor plans during allergy season:
- Check the pollen forecast today: Look for the overall level and the individual categories.
- Identify the dominant allergen: Tree, grass, weed, or mold information is more useful than a color alone.
- Review wind and weather: Note dry conditions, gusts, rain, temperature shifts, and pressure changes.
- Check air quality: Look for pollution information that may add airway irritation.
- Prepare your body and space: Hydrate according to your normal health guidance, bring sunglasses, and keep indoor exposure controls ready.
- Follow your care plan: Use prescribed or clinician-recommended allergy and migraine treatments as directed.
- Log what happens: Record exposure time, symptoms, sleep, meals, hydration, and environmental readings.
Plain-language glossary
- Pollen count: The measured number of pollen grains in a cubic meter of air. It describes airborne exposure, not a diagnosis.
- Pollen index: A category or score that translates pollen measurements into labels such as low, moderate, high, or very high.
- Allergen: A substance that can provoke an immune response in a sensitized person.
- Spore: A reproductive particle from fungi such as mold. It isn't pollen, but it can contribute to airborne allergy exposure.
- Cross-reactivity: An immune response in which proteins from related substances resemble one another closely enough to cause overlapping reactions.
- Sensitization: The process of developing an immune response to a substance. Sensitization doesn't mean every exposure will produce the same symptoms.
- Barometric pressure: The weight of the air around you. Some people track pressure changes as one possible migraine-associated environmental factor.
- Exposure: The amount of contact you have with an environmental factor. A regional forecast doesn't equal the dose you personally breathe.
The pollen forecast is one useful input, and its real value appears when you pair it with weather, air quality, and personal symptom tracking.
Seek immediate medical care for a sudden severe headache, a headache with fever or stiff neck, new neurological changes, or a headache after a head injury. This article is for informational purposes and is not medical advice. Consult a healthcare provider for personalized guidance.
Relief helps you log migraine severity, symptoms, triggers, and medications while bringing local pollen, weather, and air-quality signals into an hour-by-hour view. Visit Relief to track how environmental conditions align with your own migraine patterns and plan with fewer surprises.


