
You've promised to attend a meeting, travel, or care for your family, but you're wondering whether a migraine will make the plan impossible. Trend analysis and forecasting can use your past migraine history and environmental signals to estimate your risk hour by hour. It can help you plan, but it can't guarantee that an attack will happen or prevent one on its own.
The useful skill isn't blind trust in a forecast. It's personal migraine risk literacy, knowing what a forecast is measuring, which patterns may be meaningful, and when changing conditions make the prediction less reliable. You'll learn how to separate a lasting pattern from random variation, read a risk curve, judge forecast quality, and turn your own diary into practical information.
You can also pair this approach with everyday planning ideas in how to plan your day around migraine risk. This article is for informational purposes and is not medical advice. Consult a healthcare provider for personalized guidance.
Table of Contents
When Migraine Uncertainty Disrupts Your Plans
You check your calendar before agreeing to an early appointment. The work presentation matters, your child needs a ride, or you're trying to decide whether travel is realistic. You may feel fine at that moment, yet remember enough disrupted plans to hesitate.
That uncertainty can be exhausting, especially when other people treat migraine as an ordinary headache or assume you can push through. Migraine is a neurological condition, not just a more intense version of a typical headache. Symptoms may include throbbing head pain, nausea, sensitivity to light or sound, visual changes, or other neurological experiences. Some people have aura, a temporary set of visual, sensory, or speech symptoms, while others don't.
Trend analysis looks backward for structure. It asks whether your migraine days are becoming more frequent, clustering after one another, or appearing alongside particular personal or environmental conditions. Forecasting then uses available history and current signals to estimate what may happen next.
That estimate works more like a weather forecast than a promise. A rising risk curve might mean you'll want flexibility later in the day. A flat curve may support your plans, but it doesn't erase the possibility of an unexpected attack.
What a forecast can and can't do
A useful forecast can help you make small, protective choices before symptoms become disabling. You might schedule demanding work earlier, keep your usual care plan accessible, protect a regular sleep routine, or choose a quieter setting if your risk appears higher.
It shouldn't tell you that an attack is certain, explain every symptom, or replace clinical assessment. Forecasts are decision aids, not diagnoses.
Practical rule: Use a forecast to reduce surprises, not to blame yourself when reality differs from the prediction.
Your own records provide the context that a general model can't. Logging symptoms, severity, timing, possible triggers, and outcomes gives you something more useful than memory alone, a personal history you can review with greater clarity.
Understanding Time Series Basics Without the Jargon
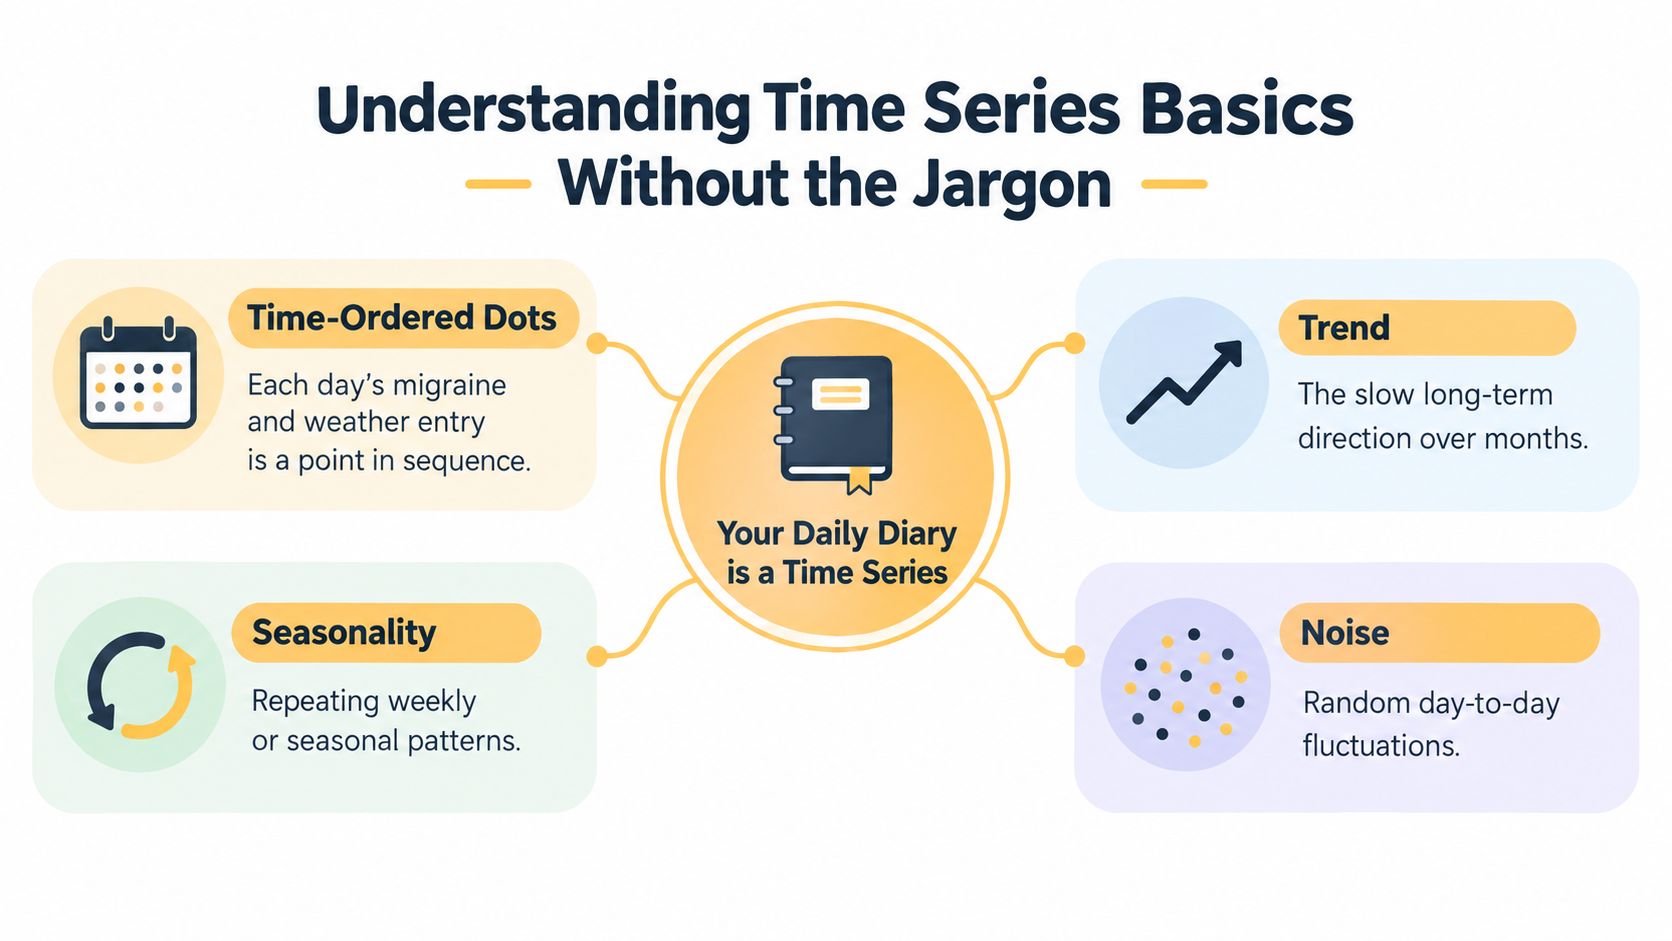
A time series is information recorded in time order. Your migraine diary becomes one when each entry connects symptoms, timing, and surrounding conditions to a specific hour or day. That timeline turns scattered experiences into something you can review before making plans.
A weather diary offers a useful comparison. It might track temperature, humidity, pressure, wind, and rain. Add migraine symptoms to the same timeline, and you can examine what happened before, during, and after an attack without assuming that every nearby weather change caused it.
Three ideas to recognize
Trend is the slow direction of change. Your records may show that migraine days are gradually becoming more frequent, or that attacks tend to last longer. One difficult week cannot establish a trend. Repeated observations over time provide a better basis for interpretation and personal risk literacy.
Seasonality is a pattern that repeats at a regular interval. In migraine tracking, it might relate to a weekly routine, work schedule, sleep pattern, or environmental condition that appears at particular times of year. A recurring pattern deserves different consideration from a one-time coincidence.
Noise is day-to-day variation without a clear pattern. Two similar weather days can have different outcomes, and an attack can occur on a day that looks ordinary in your records. Noise does not make your experience random or unimportant. It marks the uncertainty that any forecast must acknowledge.
A moving average smooths short-term fluctuations, which can make the underlying trend-cycle easier to see before forecasting. The method is described in OpenStax's overview of forecasting evaluation and time-series methods/05:_Time_Series_and_Forecasting/5.04:_Forecast_Evaluation_Methods). Smoothing can clarify a chart, but it may also hide a sudden change, so it should not be your only view.
Migraine language matters
A headache means pain in the head or face and can have many causes. Migraine may include headache, nausea, photophobia, meaning sensitivity to light, phonophobia, meaning sensitivity to sound, and other neurological symptoms.
Migraine phases can appear in different combinations. Prodrome describes early symptoms before the main attack. Aura describes temporary neurological symptoms, and postdrome is the recovery phase after the most intense symptoms. Not everyone experiences every phase, and your pattern may change over time.
Patterns can stay hidden in memory because memory favors the most painful or recent events. Consistent logging gives those patterns a timeline.
Start by recording when symptoms begin and end, rather than marking only a day as “good” or “bad.” If your health information is spread across devices or services, understanding health data integration can help you decide which records belong on the same timeline. That shared timeline makes hour-by-hour risk easier to interpret and shows where a forecast has limited information.
How Trend Analysis Separates Signal From Noise
A forecasting system can make poor decisions if it forces one explanation onto every change in your diary. A gradual increase in migraine frequency, a short run of consecutive migraine days, and a recurring environmental cycle aren't the same signal.
Technical forecasting practice often separates long-term trend, short-term autocorrelation, and seasonal structure. SAS describes the use of time-trend models for deterministic change, autoregressive models for short-term fluctuations, and seasonal models for regular recurring patterns in its forecasting procedures documentation.
The three-layer view
The long-term trend asks, “What direction is the baseline moving?” This can help you notice whether migraine frequency or duration appears to be changing gradually.
Short-term autocorrelation asks, “Does what happened recently affect what may happen next?” Migraine days aren't necessarily independent events. A recent attack, recovery period, or cluster may contain information that a long-term average misses.
Seasonal structure asks, “Does something recur?” A weekly schedule, repeated sleep pattern, or environmental cycle may matter if it appears consistently in your records.
After these components are estimated, the remaining variation is treated as residual noise. That leftover doesn't disappear. It represents uncertainty the model can't confidently explain.
Testing environmental signals
A model may consider exogenous variables, meaning outside inputs such as barometric pressure, humidity, temperature, wind, or air quality. The important question isn't whether a variable appears on the chart. It's whether adding it materially improves the forecast and reduces unexplained residual autocorrelation.
If recent clustering or recurring cycles remain in the errors, the system may be underfitting, meaning it hasn't captured structure present in the history. That doesn't prove a particular trigger causes migraine. It shows that the model should be examined more carefully.
A moving average can help isolate a trend-cycle component, but smoothing shouldn't replace review of individual attacks. A sudden severe episode may be clinically important even if it looks like a small bump on a long-term graph.
Ask better questions: What history does the forecast use? Does it account for recent clustering? How does it respond when conditions change?
You can explore practical ways to assess model behavior in how to improve forecast accuracy. The aim isn't to understand every algorithm. It's to recognize whether a tool treats your diary as a living pattern rather than a simple average.
Reading Your Hour by Hour Migraine Risk Forecast
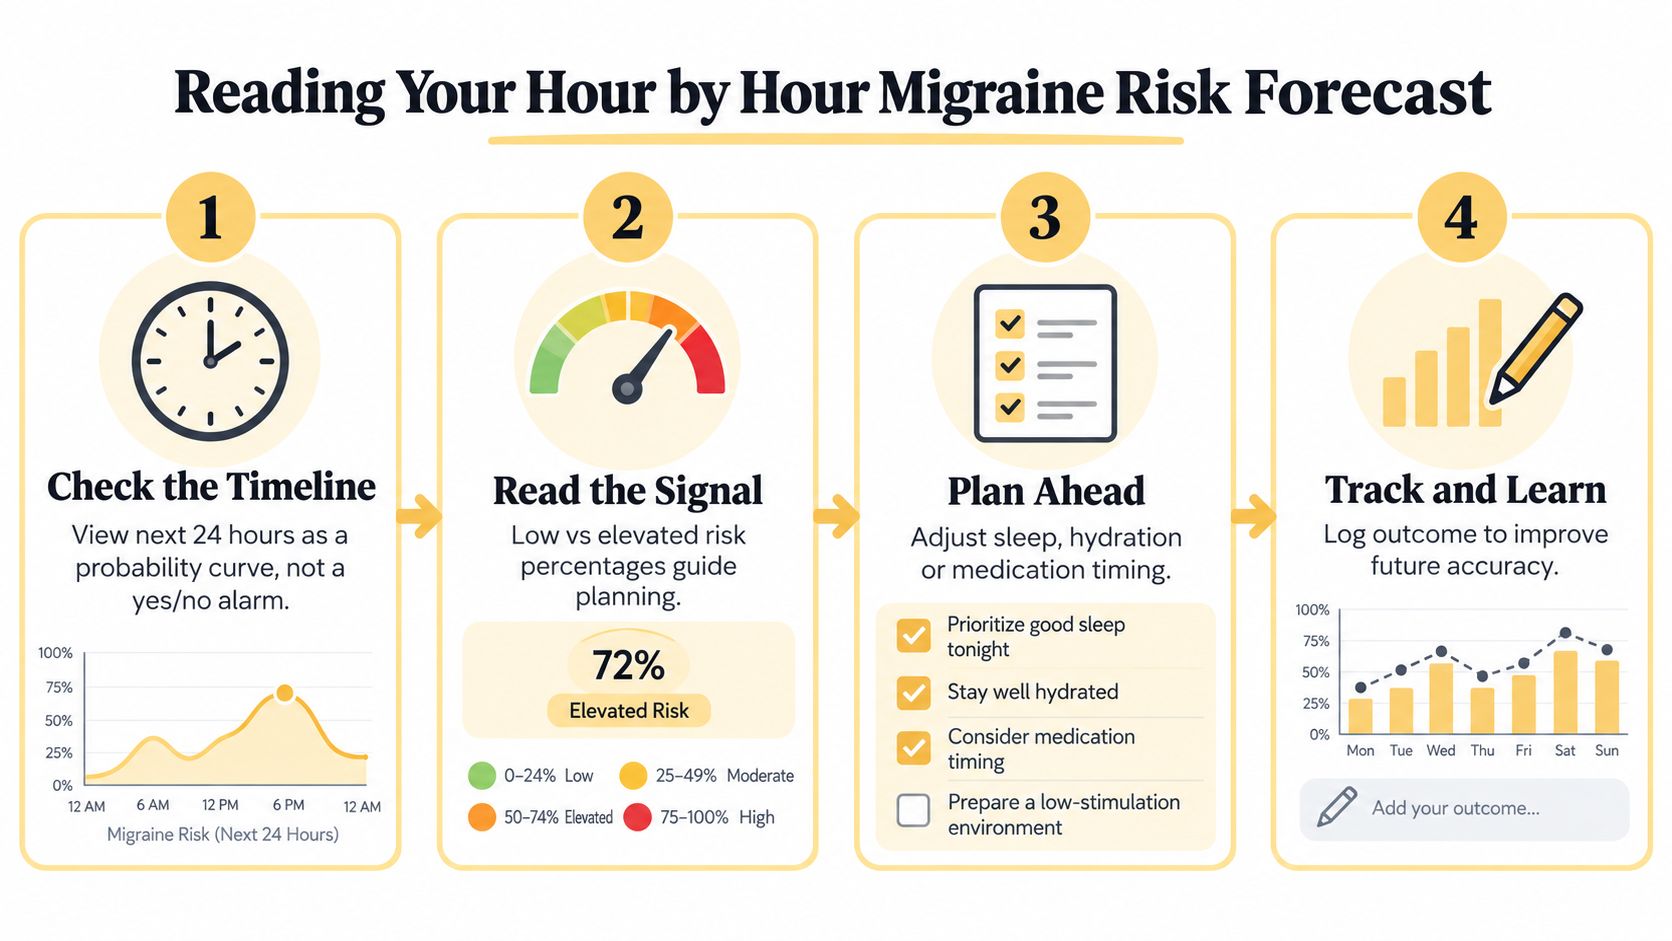
An hour-by-hour forecast should be read as a probability signal, not a yes-or-no alarm. The curve shows how estimated risk changes across the day. It doesn't predict your experience with certainty.
Start by checking the timeline. A gradual rise may suggest that conditions or recent history are becoming less favorable. A brief spike may deserve attention, but you'll want to compare it with your symptoms, recent attack history, and usual response to similar conditions.
Match the forecast to your own signals
Look for agreement between the forecast and your body. Prodrome symptoms, unusual fatigue, neck discomfort, sensory sensitivity, or changes in concentration may matter to your personal pattern. A forecast that shows risk while you feel completely normal isn't automatically wrong, and symptoms should never be dismissed because a chart looks reassuring.
Environmental information can add context. Humidity, temperature, barometric pressure, wind, and air quality may appear alongside your recent check-ins. Weather effects aren't universal. A 2024 review notes that weather may affect some people with migraine, but findings are inconsistent and weather appears to affect only about 20% of migraine attacks overall (NIH-hosted review).
Turn risk into a flexible plan
Use the forecast to adjust your choices without treating them as rules.
- Lower risk: Keep your plan, while maintaining the routines that support you. Carry what you normally use during an attack.
- Moderate or rising risk: Reduce avoidable strain, protect sleep and hydration, and place demanding tasks where you'll have more flexibility.
- Elevated risk: Consider a quieter environment, build in recovery time, and follow the care plan you've already discussed with your healthcare provider. Don't change medication use based solely on an app forecast.
Weather signals deserve careful interpretation. Research has examined pressure, humidity, and wind, but a signal that matters for one person may have little relevance for another.
Here's a short planning checklist:
- Check whether the risk is rising, falling, or stable.
- Compare the forecast with recent symptoms and attack timing.
- Note which environmental signals are unusual for you.
- Make one practical adjustment, rather than cancelling everything automatically.
- Log what happened so future forecasts have better personal context.
How to Tell If a Forecast Is Actually Useful
A forecast is useful when it helps you make a better migraine plan, not merely when it sounds precise. Ask two questions: how often does it miss, and would that miss change what you do?
Three measures describe forecast error from different angles:
| Metric | What It Tells You | When It Matters Most |
|---|---|---|
| MAE | The average absolute gap between the forecast and what happened, using the original units | Helpful for understanding typical error without letting unusual misses dominate |
| RMSE | Larger misses count more because errors are squared before averaging | Useful when one serious miss could disrupt an important day |
| MAPE | Error shown as a percentage of the actual value | Useful for comparing different baselines, but unstable when actual values approach zero |
The definitions are explained in OpenStax's forecast evaluation methods/05:_Time_Series_and_Forecasting/5.04:_Forecast_Evaluation_Methods). For personal migraine risk, MAE can show the usual gap between predicted and observed risk. RMSE draws attention to occasional large misses. MAPE may help compare forecasts across people or regions when their underlying values are suitable.
The right measure depends on the consequence of being wrong. If a missed high-risk period could leave you without support during an important workday, a metric that highlights large errors deserves attention. If you want a simple sense of typical performance, MAE may be easier to interpret.
Accuracy changes with circumstances
A forecast that worked during a stable routine may struggle after a major disruption. In emergency-department forecasting, average error rose from 3.88% before COVID-19 to 15.21% during the pandemic, then improved to 6.45% afterward. The authors noted that abrupt disruptions can reduce accuracy (study PDF).
The same caution applies to migraine forecasting. An unusual illness, major schedule change, travel, extreme weather, or a new pattern can weaken relationships learned from earlier data. Treat the forecast like a weather map with missing pieces. Use it more confidently when its past performance is shown across ordinary and disrupted periods, and more cautiously when your current circumstances fall outside its history.
Turning Your History Into Personal Patterns
Memory may tell you that migraines “seem worse lately.” A diary turns that impression into questions you can examine: Are attacks clustering, lasting longer, beginning at a different hour, or appearing after a recurring exposure?
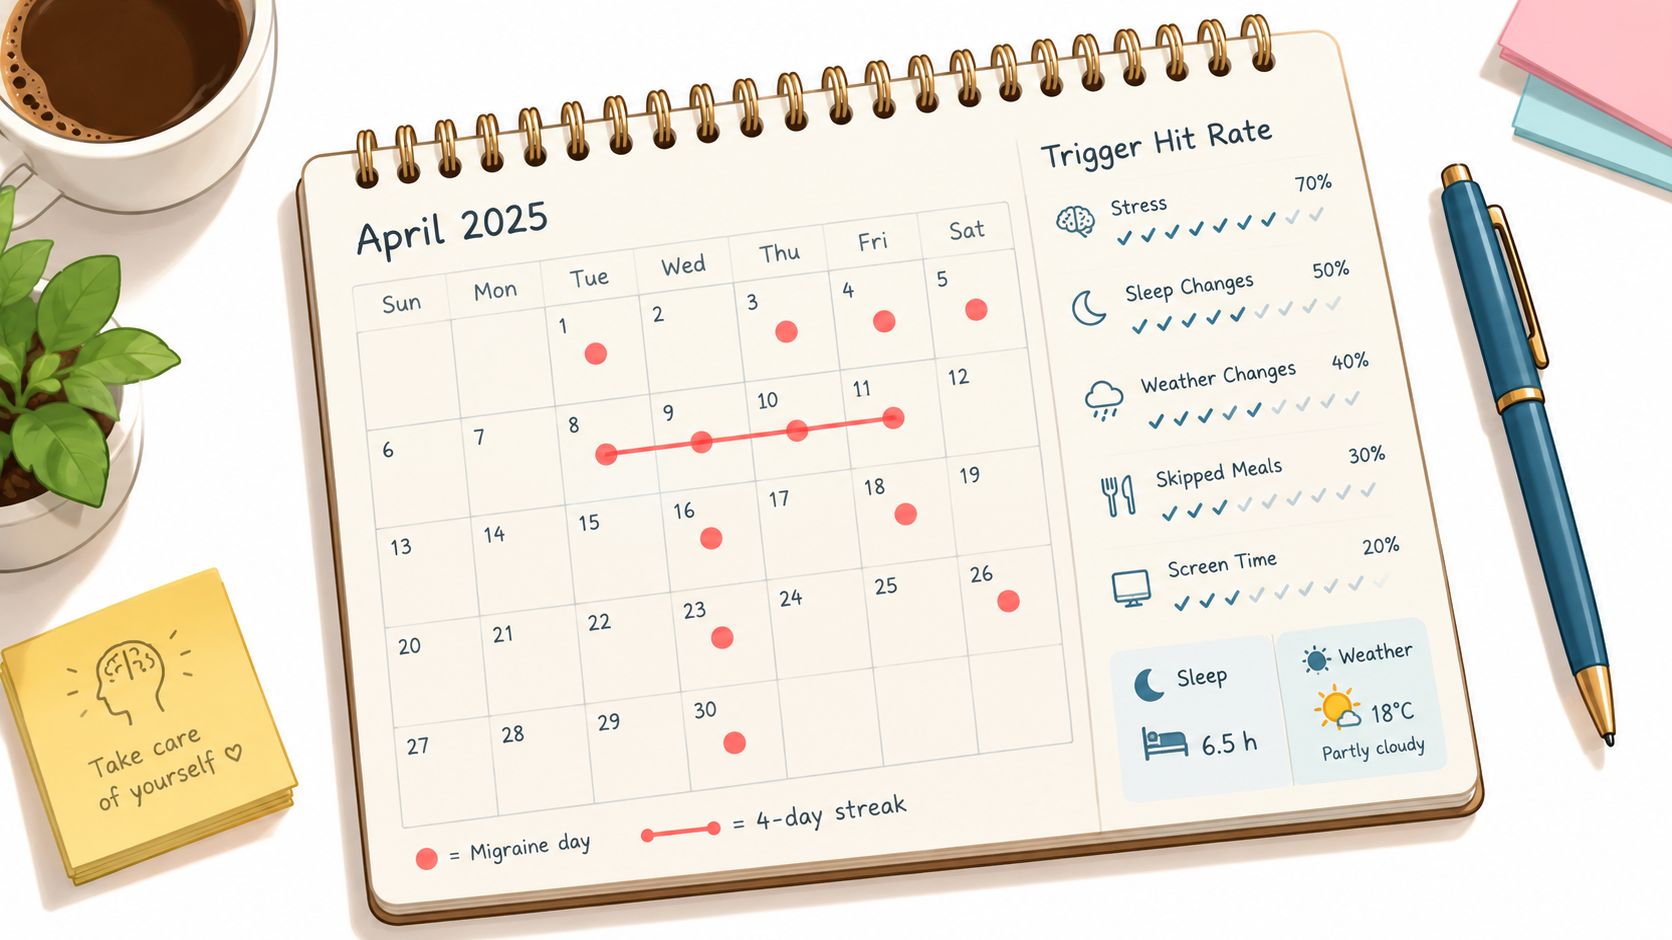
A peer-reviewed diary study found that migraine days cluster over time. In other words, the chance of migraine on one day may partly depend on what happened the day before, rather than each day acting like an unrelated coin toss (peer-reviewed diary study). Reviewing recent streaks and short-term shifts can therefore add context that a long-term average misses.
What to record
Keep entries short enough to maintain. Useful fields include:
- Timing: Record when symptoms begin, ease, and fully resolve.
- Experience: Note pain severity, nausea, photophobia, aura, dizziness, and other symptoms.
- Context: Add sleep quality, meals, stress, physical exertion, travel, and relevant environmental conditions.
- Actions: Log medications or other measures used. Do not change how you use them based on a forecast alone.
- Outcome: Mark whether the suspected signal was followed by migraine, no migraine, or an uncertain result.
Then examine exposure hit rates, or how often a suspected exposure and migraine occur together in your records. A high hit rate can identify a pattern to discuss with a healthcare provider. It does not prove that the exposure caused the attack. Another factor may have occurred at the same time, and triggers differ widely between people.
Pressure as an example, not a rule
Pressure shows why personal records matter. A Japanese study reported that migraine occurred most often when atmospheric pressure fell by 6 to 10 hPa relative to standard pressure, with attack rates of 23.5% at 1005 to less than 1007 hPa and 26.5% at 1003 to less than 1005 hPa (peer-reviewed pressure study). These findings describe one research setting, not a universal response for everyone with migraine.
Use research to choose what you might monitor, then compare it with your own history. If attacks repeatedly follow a similar pressure change, that relationship may improve your personal risk literacy. If the pattern appears only once or disappears when sleep, meals, or stress are considered, treat it as noise rather than a dependable forecast signal.
Review migraine-free streaks, total migraine hours, typical attack time, and changing severity. Together, these measures can show improvement or worsening that a monthly attack count alone may hide.
Using Forecasts Wisely and Knowing When to Seek Care
A forecast earns your attention when it supports a practical choice, such as planning rest, medication discussions, or a lower-demand day. It becomes less helpful when it keeps you checking constantly, makes ordinary activities feel dangerous, or turns every weather change into a guaranteed trigger.
Read each prediction as a risk estimate, not a promise. Weather affects people with migraine differently, and a more complex AI system does not automatically perform better in daily life. Forecast quality depends on the information available, the question being asked, and whether the result arrives soon enough to guide a decision.
Research from retail and supply-chain forecasting illustrates this limitation. A 2025 systematic review found that newer approaches produced only modest improvements over strong classical methods, with results varying by context and data quality (systematic review PDF). For personal migraine tracking, incomplete logs or delayed review can weaken an otherwise advanced forecast. A simple model based on consistent records may be more useful than an advanced model fed with gaps.
Use your hour-by-hour forecast as a planning aid. Compare it with your symptoms, recent sleep, meals, medications, and known patterns. Afterward, record what happened. Over time, this calibration shows whether a high-risk period usually matches your experience or whether it often proves to be noise.
When to seek immediate care
A forecast should never delay urgent assessment. Seek immediate medical care for:
- A sudden, severe headache: Especially when the pain reaches maximum intensity abruptly.
- Fever with a stiff neck: This combination needs urgent evaluation.
- Neurological changes: New weakness, confusion, fainting, trouble speaking, or other sudden neurological symptoms require immediate care.
- A headache after head injury: Get prompt medical assessment rather than relying on your usual migraine pattern.
This article is for informational purposes and is not medical advice. Consult a healthcare provider for personalized guidance.
Relief brings personal logging, environmental context, and hour-by-hour forecasting together on iOS, so you can review patterns and plan with fewer surprises.
Relief lets you log severity, symptoms, triggers, and medications in seconds, then view personal trends alongside local weather and air-quality signals. Visit Relief to turn your migraine history into practical information for planning your day.


