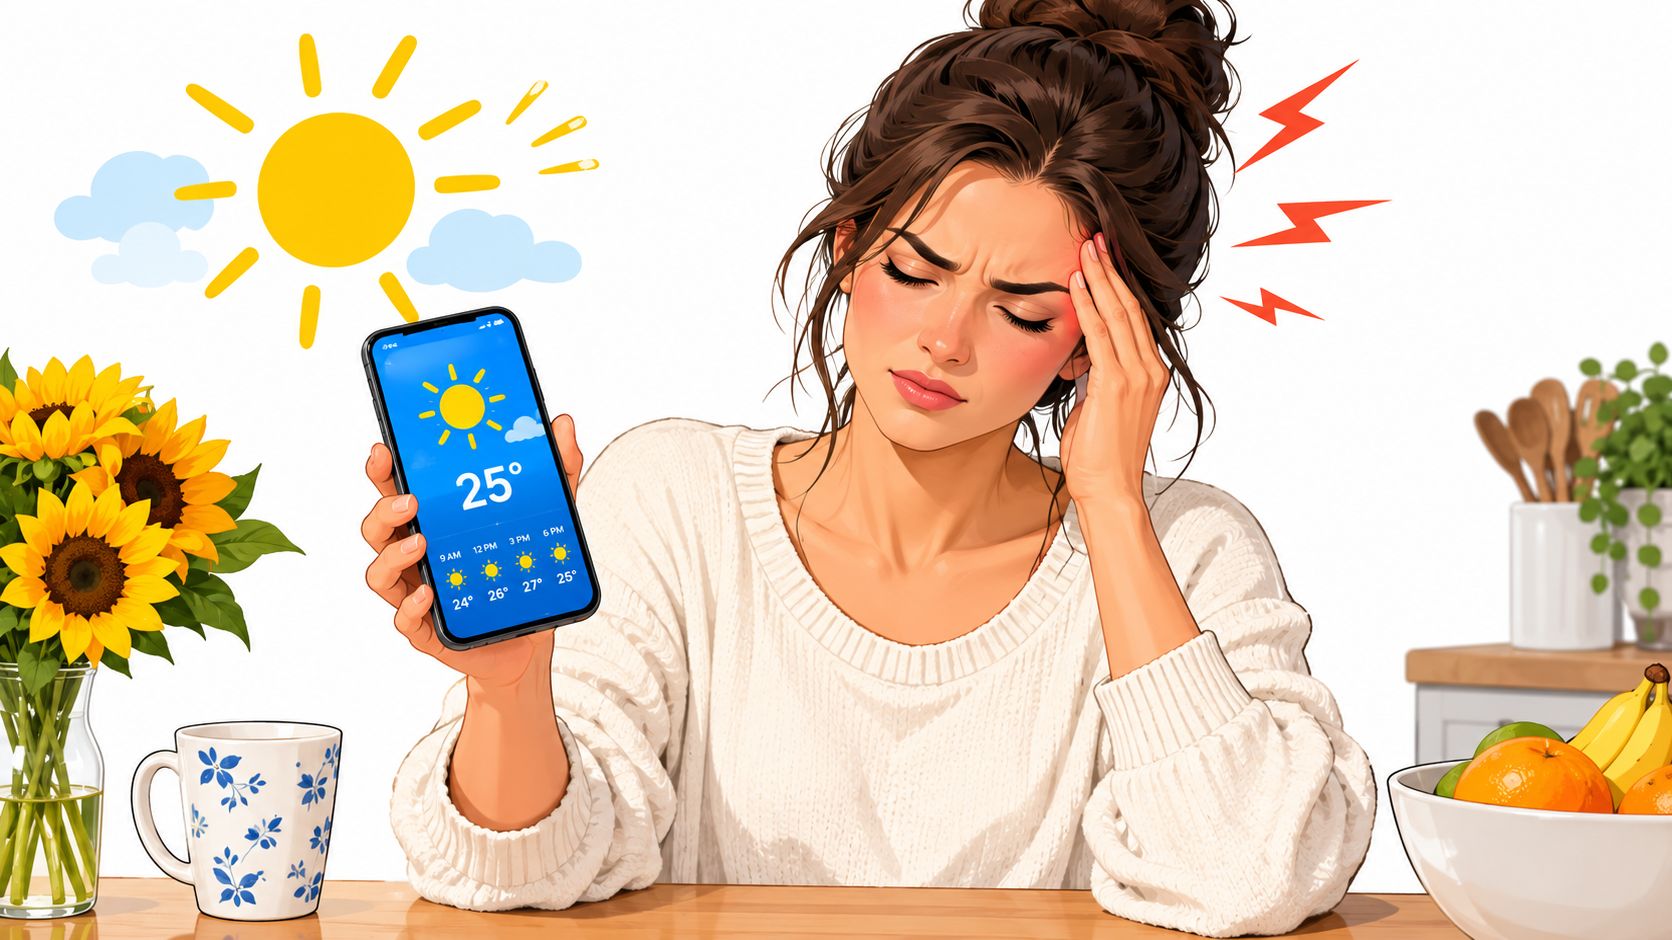
You check the forecast. It's sunny, the temperature looks ordinary, and yet a migraine arrives before lunch. “Watch the weather” feels useless when the pattern may involve an hourly pressure drop, a change in humidity, or an increase in PM2.5 or ozone that your standard weather app never shows.
Weather and air quality can influence migraine attacks for some people, but they aren't universal triggers. The practical answer is to track specific environmental measurements alongside your symptoms, then use your own history to separate a meaningful pattern from a coincidence. This article is for informational purposes and is not medical advice. Consult a healthcare provider for personalized guidance.
Table of Contents
Beyond the Weather Report - Why Air Quality Matters for Migraine
A sunny forecast doesn't guarantee a migraine-safe day. You might spend the morning feeling fine, notice pressure behind one eye in the afternoon, and later develop photophobia, meaning sensitivity to light. By evening, the attack may seem to have appeared without a clear cause.
That frustration is understandable. “Bad weather” is too broad to guide a decision. Temperature, humidity, barometric pressure, wind, and airborne pollutants can change on different schedules, sometimes within the same day. A weather app may show the temperature and chance of rain while leaving out the environmental details that matter most to your nervous system.
Why the air belongs in your migraine diary
Air quality isn't only an issue for people with asthma. Pollutants can irritate the respiratory system and contribute to broader physiological stress, while some people with migraine may be sensitive to environmental changes that don't feel obvious at first.
The scale of exposure makes this worth taking seriously. The World Health Organization's historical overview of air quality notes that air pollution was linked to more than 6 million premature deaths worldwide by 2012, with later estimates reaching about 6.7 million global deaths in 2019. The WHO's 2024 fact sheet states that 99% of the world's population lived in places where air pollution exceeded its guideline levels.
That doesn't mean polluted air causes every migraine, or that a high reading predicts an attack with certainty. It does mean air quality is a widespread exposure that deserves a place beside weather variables when you're looking for personal patterns. You can also review this guide to environmental factors and health for a broader way to think about non-food triggers.
What your forecast may be missing
A weather forecast usually answers, “Will it rain, and how warm will it be?” A migraine-focused view asks different questions:
- Is barometric pressure falling rather than just low?
- Is ozone increasing during the hours you'll be outside?
- Are PM2.5 particles higher because of traffic, stagnant air, or smoke?
- Did your symptoms begin after an exposure, or before it?
- Did several smaller stressors combine, such as heat, poor sleep, bright light, and pollution?
Those questions produce more useful information than labeling a day “bad weather.” They also reduce the temptation to blame every attack on a single dramatic shift.
Understanding Air Quality Metrics - PM2.5, Ozone, and More
An “unhealthy” air-quality label can hide the exposure that matters to your migraine pattern. Use the label as an alert, then open the detailed reading and record the pollutant, value, time, and duration when your app or local monitoring service provides them.
Start with the particles
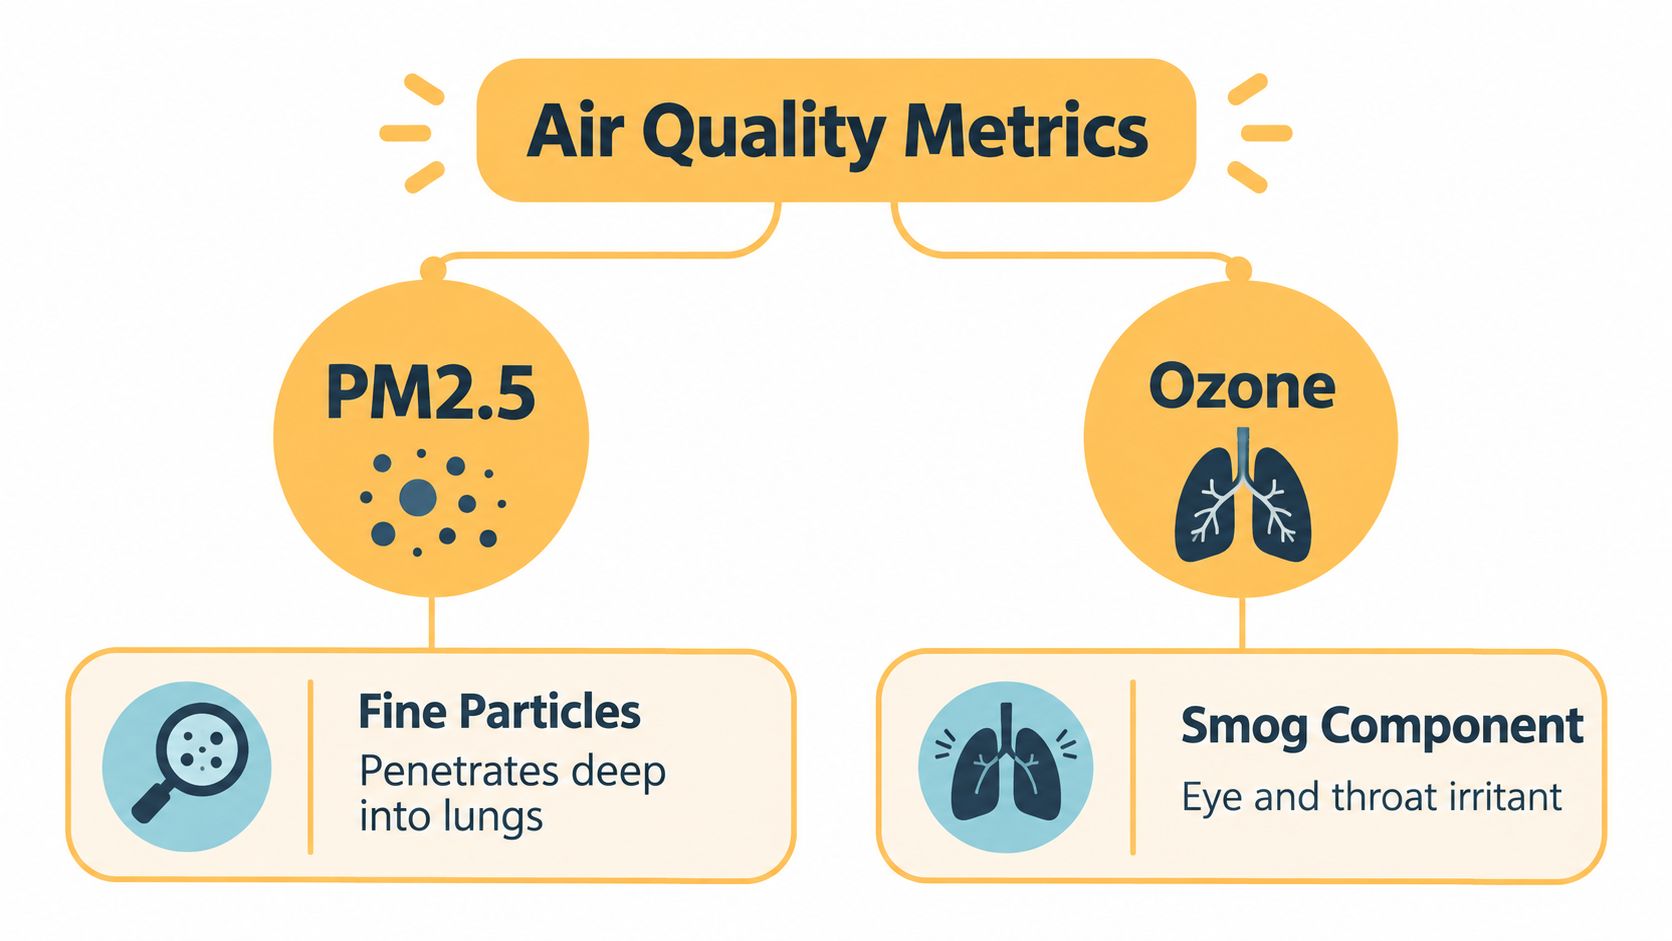
PM2.5 means fine particulate matter with a diameter of 2.5 micrometres or less. These particles can travel deep into the lungs, so monitoring services report them separately. PM10 covers larger inhalable particles, including dust and other coarse pollution.
A PM2.5 value of 35 µg/m³ sustained over three hours is a different signal from a brief spike to 90 µg/m³ during your commute. Log the level and duration together rather than saving only the category. Note whether symptoms followed the rise, how quickly they appeared, and whether the same sequence repeats. This guide to measuring air quality can help you decide which readings to capture.
Understand the gases
Ozone is a smog component formed near ground level when sunlight drives chemical reactions involving other pollutants. Rising ozone can irritate the eyes and airways, and some people with migraine notice symptoms on days when its concentration increases.
Nitrogen dioxide, or NO2, commonly comes from combustion, including traffic and fuel-burning equipment. Carbon monoxide, or CO, is also produced by combustion. It has no colour or smell, so your senses cannot warn you about its presence. Household carbon monoxide alarms remain necessary for safety, separate from migraine tracking. The WHO's ambient air pollution training material explains these pollutants and their health context.
Track the driver, not just the label
For each exposure, record the pollutant, approximate level or category, time of day, duration, and whether you were indoors or outdoors. A short, high reading during a commute may produce a different pattern from a lower reading during several hours outside. Add weather context, especially whether pressure was falling, because several exposures can overlap.
Log symptoms with equal precision. Headache is a symptom; migraine is a neurological disorder that may include throbbing pain, nausea, aura, photophobia, phonophobia, and postdrome, the drained or foggy phase after an attack. Recording those features lets you compare similar events instead of treating every episode of head pain as the same. Over time, the useful result is not a universal threshold. It is a personal record showing whether PM2.5, ozone, NO2, pressure changes, or combinations consistently appear before your attacks.
The Science - How Pollution and Weather Trigger Migraines
You may notice that an attack follows “bad weather,” yet the useful question is more specific: which hourly exposure changed first, and by how much? Research supports a cautious conclusion. Weather and air pollution can be associated with migraine attacks or headache-related care, but the pattern varies by population, pollutant, timing, and study design.
A 2025 meta-analysis of 31 studies found significant associations between weather changes and migraine attacks. Ambient pressure had an odds ratio of 1.07, with a 95% confidence interval of 1.01 to 1.15. Temperature had an odds ratio of 1.15, with a 95% confidence interval of 1.02 to 1.29. Humidity was not statistically significant, with an odds ratio of 1.04 and a 95% confidence interval of 0.97 to 1.11, as reported in the 2025 migraine and environmental exposure meta-analysis.
Pollution signals are not interchangeable
The analysis also linked higher pollution levels with more migraine clinical visits. Reported odds ratios were 1.07 for PM10, 1.04 for PM2.5, 1.08 for NO2, 1.08 for CO, and 1.12 for ozone, as detailed in the analysis cited above.
These findings do not show that one pollutant will trigger your next attack. They show why “air quality” is too broad for useful self-tracking. Your personal signal may be ozone, fine particles, pressure change, or a combination that appears only when hourly exposure data is matched with your symptom diary.
Pressure and temperature need context
A prospective diary-based cohort of 98 episodic migraine patients in Greater Boston found that temperature and barometric pressure were generally not associated with migraine onset. A separate case-crossover study of 7,054 headache-related emergency visits found that a 5°C increase in mean ambient temperature during the prior 24 hours was associated with higher acute headache risk. The reported odds ratio was 1.075, with a 95% confidence interval of 1.021 to 1.033, in the weather and headache study.
The difference reflects what each design measures. Diary studies follow everyday symptoms, while emergency-visit studies capture more severe episodes requiring acute care. Neither result provides a universal threshold.
A 12-month Berlin diary study associated headache onset and higher intensity with lower temperature and higher humidity, as reported in the pressure and headache diary research. A 2024 systematic review connects low barometric pressure and pressure drops with increased headache occurrence, while noting inconsistent results across studies.
Use environmental readings as context for symptoms, not as a diagnosis or guarantee. For a structured way to quantify exposure, see our guide to environmental exposure assessment.
Weather Forecasts vs. Air Quality Insights - What You Need to Know
You check tomorrow's forecast, see mild temperatures, and plan an outdoor run. By evening, a migraine has started. The forecast may have been accurate, yet it did not show the hourly pollutant or pressure pattern that preceded your attack.
A standard weather forecast supports general planning. It usually covers temperature, precipitation, wind, and sometimes pressure. An air-quality service answers a narrower question: which pollutants are present, and how high are they? Local pressure readings add another layer by showing whether conditions are stable, rising, or falling.
| Standard forecast | Environmental migraine tracking |
|---|---|
| Temperature and precipitation | Temperature trend and timing |
| General wind information | Wind changes that may move pollutants |
| A broad pressure value | Pressure direction and rate of change |
| Limited pollution context | PM2.5, PM10, ozone, NO2, and CO |
| City-level planning | Local or neighborhood readings when available |
Why the local picture remains imperfect
The useful signal may be hourly and highly local, while monitoring often remains at city or county scale. The World Meteorological Organization's Air Quality and Climate Bulletin identifies the need for better atmospheric observations of pollutants such as PM2.5 and ozone.
Forecasting adds another limitation. NOAA notes that predictability for many air pollutants often doesn't extend much beyond about two days, as cited in the bulletin above. An app can therefore support planning without providing reliable advance warning for every personal attack.
Track the two data streams together. Compare pressure direction and temperature timing with PM2.5, ozone, and other pollutant readings around the hours you commute, exercise, or spend time outdoors. Over repeated episodes, that record can show whether “bad weather” is a pressure shift, a pollution spike, or a combination.
Practical Tips to Reduce Exposure During High-Risk Conditions
You can't control the pressure outside or eliminate every pollutant. You can reduce the total exposure your body receives and avoid stacking several possible triggers on the same day.
Adjust the hours, not your entire life
If ozone or particulate matter is high, consider moving outdoor exercise to a lower-exposure period or choosing an indoor option. Keep the change proportionate. A short delay may be realistic, while cancelling every plan based on a forecast can increase stress and isolation.
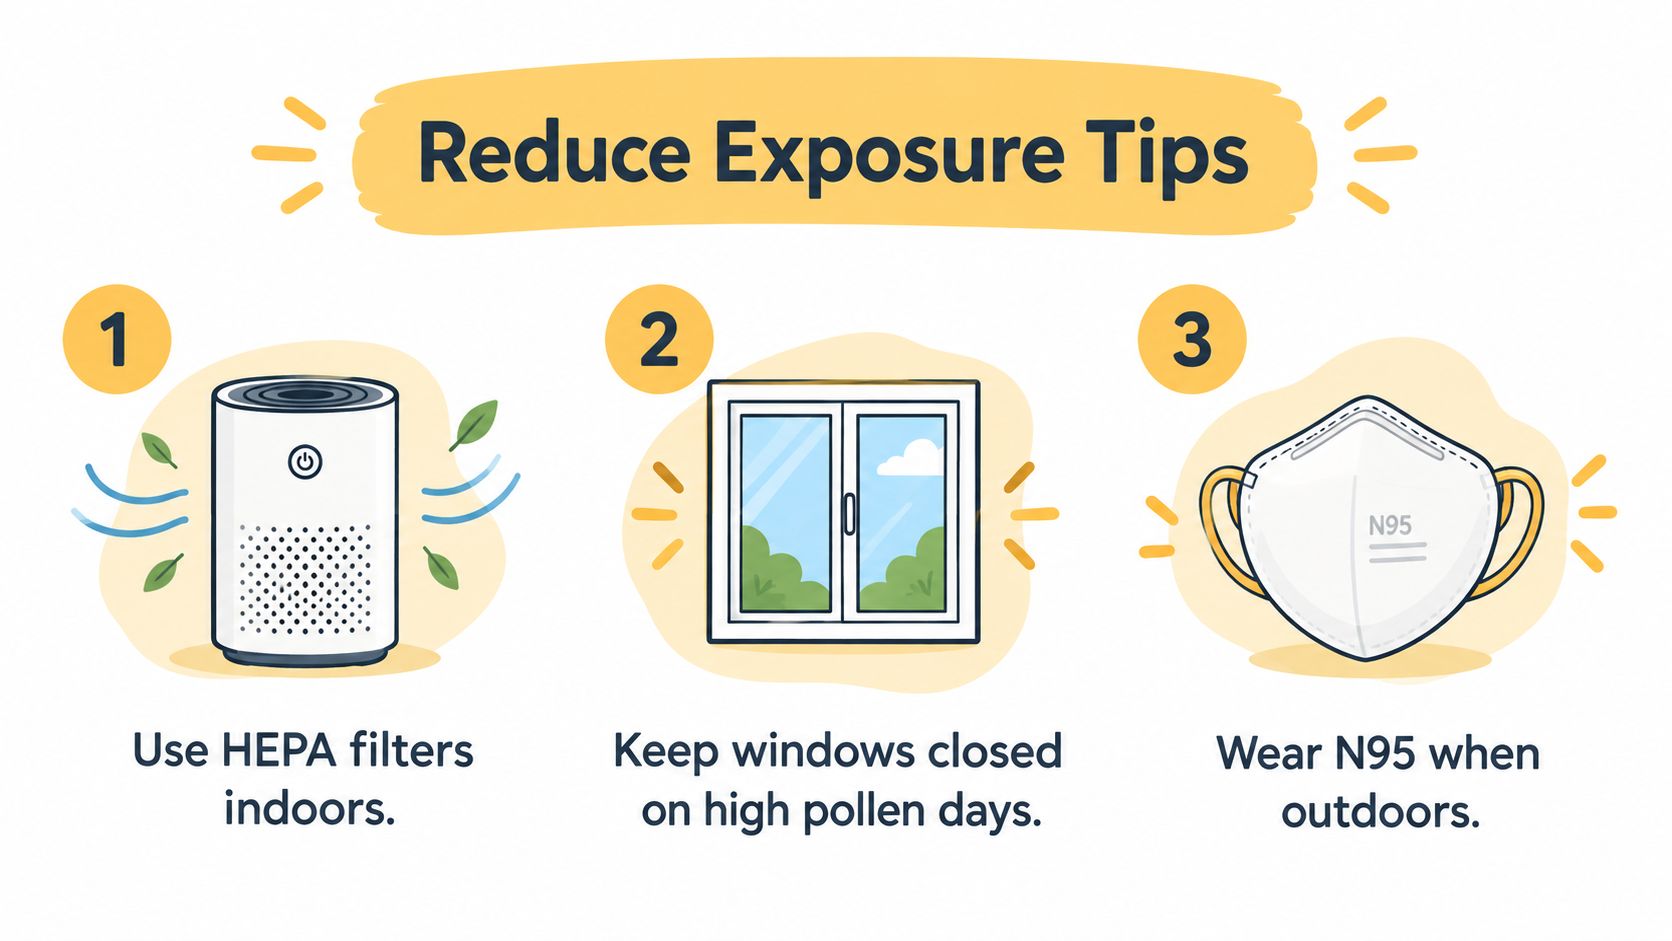
During smoke events or clearly poor air quality, close windows and doors when official guidance recommends staying indoors. Avoid indoor activities that add particles, such as burning candles or creating unnecessary smoke. If you use an air cleaner, a properly maintained HEPA filter may help reduce airborne particles indoors, but it won't remove every pollutant or replace public-health advice.
Protect yourself outdoors
A well-fitting respirator designed to filter fine particles may reduce exposure during smoky conditions, but ordinary surgical masks don't provide the same protection against all pollutants. Follow guidance from local health authorities, especially when wildfire smoke or other hazardous conditions are present.
Use the following checklist when conditions look unfavorable:
- Check the specific pollutant: Don't rely only on the overall AQI category.
- Choose a lower-exposure route: Avoid heavy traffic or visibly smoky areas when possible.
- Shorten outdoor time: Reduce duration rather than assuming you must stay indoors all day.
- Keep windows closed during smoke: Recirculate indoor air in the car instead of drawing air from outside.
- Protect sleep and hydration: Heat, disrupted sleep, and dehydration can add stress to an already sensitive system.
Hydration isn't a cure, and it won't cancel a pollutant exposure. It's one basic part of keeping your routine stable, particularly during hot conditions. If a weather or air-quality change repeatedly precedes symptoms, discuss the pattern with your healthcare provider rather than making major treatment changes alone.
Using Data to Predict and Prevent Your Next Attack
The most useful forecast is personal. Population research can show that a relationship exists, but your diary can reveal whether your attacks tend to start after a pressure drop, during warmer summer temperatures, after exposure to ozone, or following a combination of environmental and personal factors.
A 2026 case-time series study involving 69,808 health events reported that migraine attacks were more likely to begin after exposure to higher NO2 or ozone, colder winter temperatures or warmer summer temperatures, and changes in barometric pressure, according to the case-time series research. That supports the value of viewing environmental conditions as time-linked signals rather than vague labels.
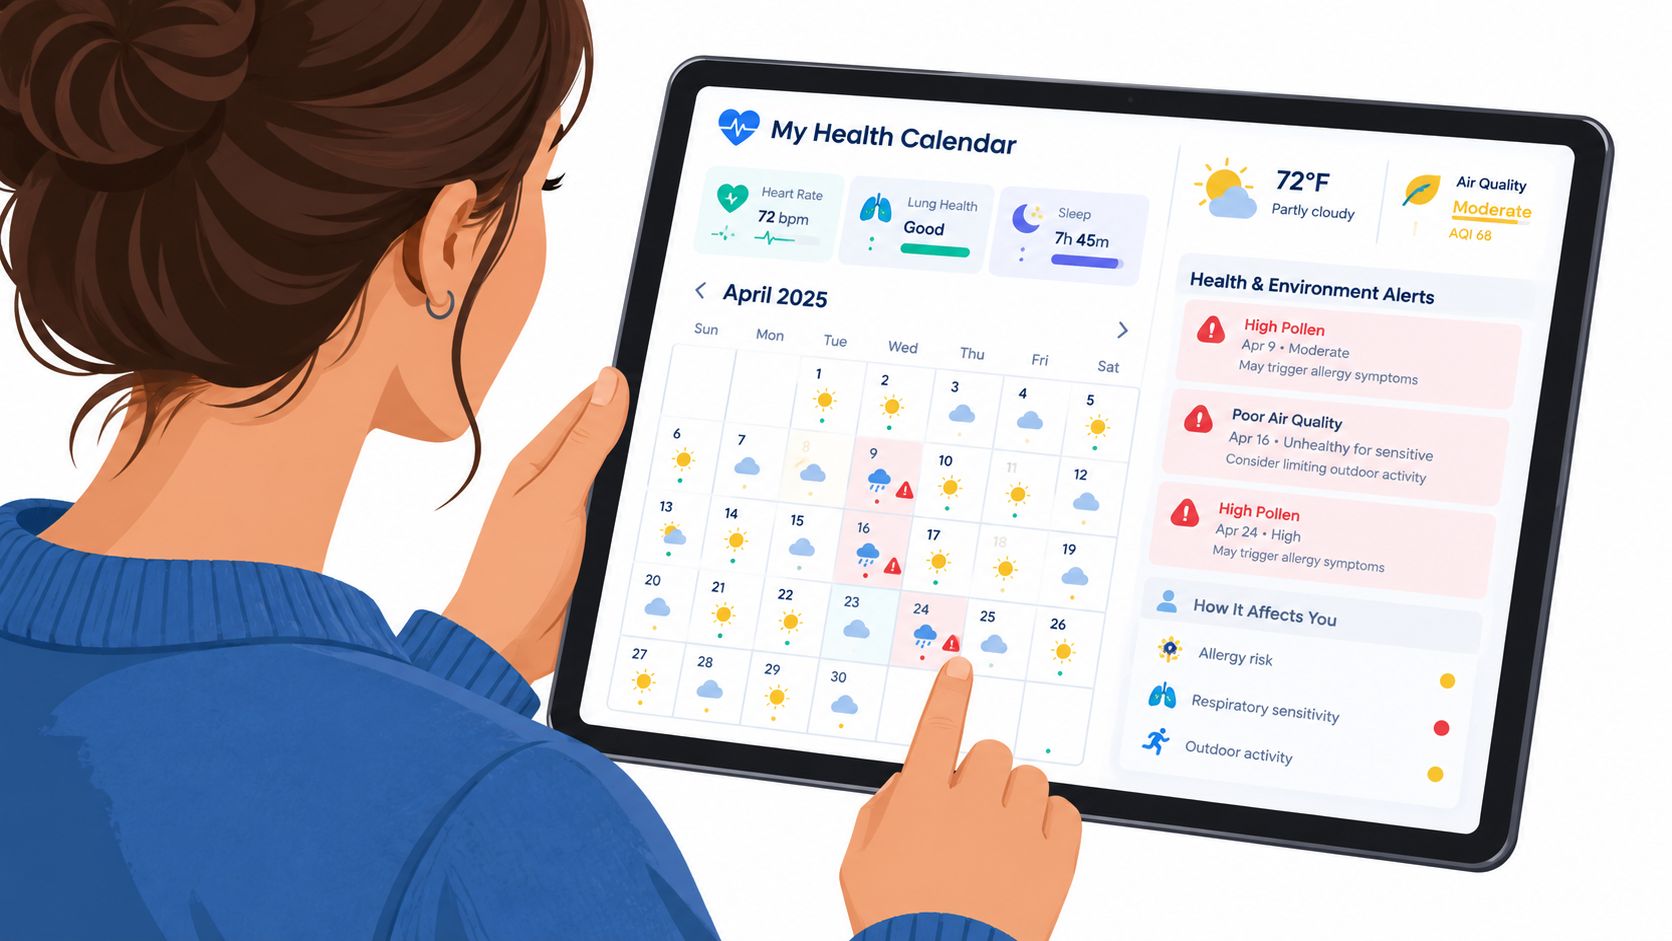
Build a useful personal record
Log the beginning and end of each attack, not just the day it occurred. Add aura if present, nausea, photophobia, phonophobia, prodrome symptoms, pain intensity, and postdrome symptoms. Note whether you were working outdoors, commuting, exercising, or spending most of the day inside.
Then compare the log with environmental conditions:
- Record the timing: Note when symptoms began and when the possible exposure occurred.
- Separate variables: Save pressure trend, temperature, humidity, PM2.5, ozone, and other available readings.
- Look for repetition: A single coincidence is weak evidence. A recurring sequence is more worth discussing.
- Check competing explanations: Include sleep disruption, skipped meals, stress, illness, bright light, and your menstrual cycle if relevant to your experience.
- Review with a clinician: Bring your observations to an appointment before changing prescription treatment or using medication differently.
Relief is one tool that combines local weather and air-quality information with health logs to provide an hour-by-hour migraine risk forecast. It can help you compare environmental signals with logged symptoms and identify patterns specific to your history, but it isn't a medical treatment or replacement for professional care.
A forecast can help you plan around risk. It can't tell you with certainty whether an attack will happen.
The goal isn't to obey every alert. It's to make informed adjustments when several signals line up, such as high ozone, a pressure change, heat, and a day when you already slept poorly. That approach is more sustainable than treating every weather shift as dangerous.
Taking Control - Next Steps for Proactive Migraine Management
You don't need to become a meteorologist to learn from your environment. Start with a simple record: attack time, migraine symptoms, location, outdoor exposure, pressure trend, temperature, and the pollutant responsible for the air-quality reading.
Review the record periodically rather than after every uncomfortable day. You may find that “weather” is too broad a label. Your pattern might involve pressure drops, ozone, seasonal temperature changes, or no consistent environmental relationship at all. A 2024 review estimated that weather's effect on migraine attacks was around 20%, while also emphasizing inconsistent findings across studies in its review of weather and migraine.
That uncertainty doesn't invalidate your experience. It gives you a reason to test patterns carefully and avoid unnecessary restrictions. Weather and air quality may matter for you, but they interact with sleep, stress, hormones, illness, light, hydration, and individual biology.
Seek immediate medical care for a sudden severe headache, a headache with fever or stiff neck, new neurological changes, or a headache after a head injury. This article is for informational purposes and is not medical advice. Consult a healthcare provider for personalized guidance.
Relief can help you log attacks and compare symptoms with local weather and air-quality signals, so you can spot patterns and plan around higher-risk hours.
If weather and air quality seem connected to your attacks, Relief lets you track symptoms alongside local environmental conditions and view an hour-by-hour risk forecast. Start logging the details that matter to you, then bring recurring patterns to your healthcare provider for a more informed conversation.


